Historical retrospective — researched 7 November 2026. This article examines a September 2021 social-media study that ranked fast-food brands by negative tweets. The phrase “Open Post” in the lost FlyingEze headline indicates a discussion-style item, but its original publisher, complete text and FlyingEze publication timestamp have not been independently recovered. These are historical 2021 findings, not current consumer rankings.
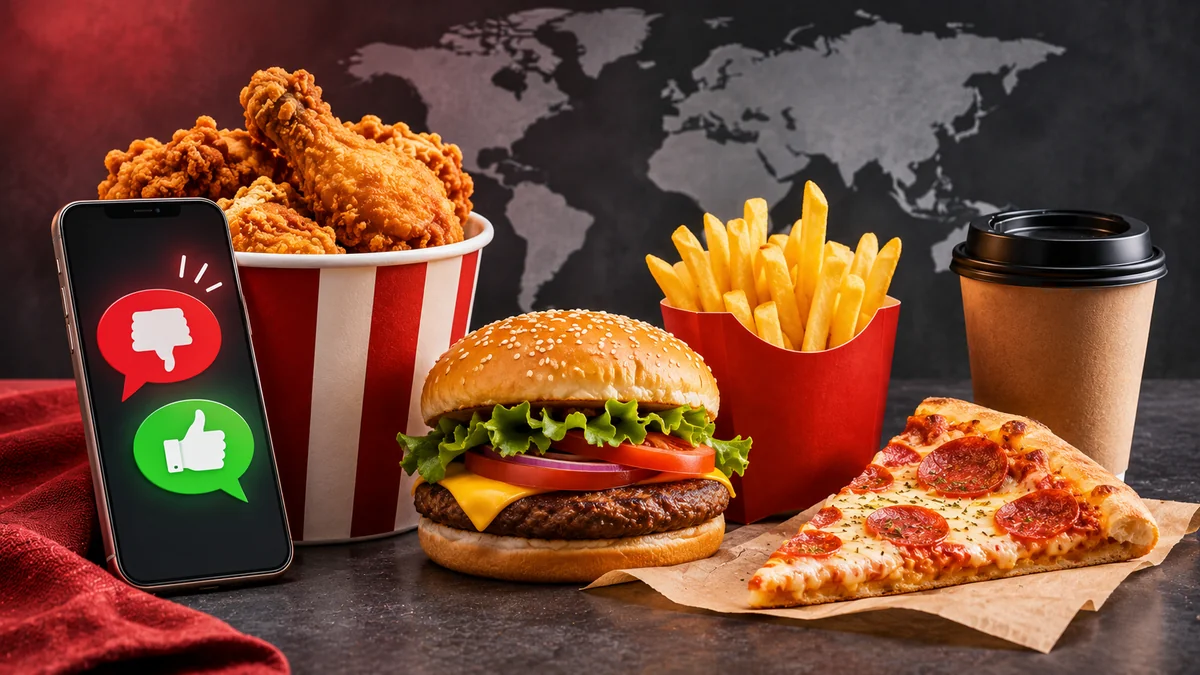
In September 2021, a social-media analysis by RAVE Reviews declared KFC the “most hated” fast-food chain across the largest number of countries examined, while Wendy's was the leading negative-sentiment brand in another 11 countries. In the United States, Domino's attracted the highest percentage of negative tweets among the selected fast-food brands. These were results from automated analysis of Twitter posts, not votes cast in a representative international poll, a review of restaurant hygiene or a measure of food quality.
The results were discussed by The Takeout on 24 September 2021 , Matador Network on 27 September and Fast Company on 5 October . Their reporting confirms the broad methodology and some striking country results. The original headline “Open Post: Hosted by the Most Hated Fast Food Chains in the World” appears to refer to commentary on the same viral map, but an accessible copy of that precise “Open Post” article has not been located.
The headline is attention-grabbing because everyone has opinions about takeaway food. Understanding the study, however, requires asking what was counted, which brands were compared, how the word hate was defined and whether a tweet can stand for a country's opinion.
What did the 2021 “most hated fast-food chains” ranking say?
RAVE Reviews, a review and buying-guide website, commissioned an analysis of social-media posts about prominent brands. It grouped results by geography and industry, including fast food, technology and gaming. The resulting maps named a brand in each category for which the selected tweets showed the highest share of negative sentiment.
Contemporary Matador Network coverage summarised the number of countries in which each major chain topped the fast-food category:
| Fast-food brand | Countries where it led the 2021 negative-tweet ranking |
|---|---|
| KFC | 14 |
| Wendy's | 11 |
| Starbucks | 5 |
| Domino's | 4 |
| McDonald's | 4 |
| Subway | 4 |
| Burger King | 3 |
| Taco Bell | 3 |
These figures count countries in which a brand ranked first among the sampled brands; they do not count the number of dissatisfied customers worldwide. One country contributes one position in the table regardless of its population, the number of restaurants it contains or the volume of comments collected. A global chain present in numerous markets also has more opportunities to appear on a country map than one operating in only a few locations.
There is no sound basis for reusing that table as a ranking of today's restaurants. It is a snapshot of a specific dataset circulated in late September 2021.
How did researchers decide whether a tweet was negative?
RAVE Reviews used SentiStrength, a program developed for analysing sentiment in short, informal text. The company said its overall project processed more than one million brand-related tweets across its various categories. That number should not be incorrectly described as one million responses to a fast-food-only survey.
In the study's publicly reproduced methodology, posts referring to selected brands were retrieved through Twitter's programming interface, then scored for positive and negative language. Tweets whose negative component received a SentiStrength score from −2 to −5 were classified as negative for this analysis. The researchers then calculated the percentage of such messages in the sample for each brand and location.
The team also reported excluding a brand from a country's calculation where fewer than 10 unique users had tweeted about it. This minimum was a threshold for inclusion, not evidence of a statistically representative country sample. The original RAVE study page is no longer available at its old publisher URL; its methodology survives in contemporary reproduction and reporting .
SentiStrength itself is a real, published research method. Its original developers, including Mike Thelwall, described the approach in a 2010 academic paper on detecting sentiment in informal online messages . The software can estimate the strength of positive and negative language, but even a valid sentiment-analysis tool does not automatically prove why someone wrote a post or whether they personally purchased the product being discussed.
Why was KFC described as the world's “most hated” chain?
Under RAVE Reviews' way of counting country leaders, KFC ranked first in the fast-food category in 14 countries, more than any other brand in the selected study. Mashed's contemporary summary identified places including France, New Zealand, Singapore, Saudi Arabia and several Caribbean and African countries.
This finding can easily be misunderstood. It does not mean that most residents of each country hated KFC. Nor does it establish that KFC's food, service or safety were worse than every competitor. It means that, among the tweets and brands examined in those locations, KFC had the highest calculated negative-sentiment percentage.
A company operating across many international markets may appear in the map more frequently simply because it is eligible in more places. Even then, a percentage of negative tweets can reflect anything from a complaint about long queues to a joke, an advertising dispute or a temporary controversy. The study did not audit every restaurant or check the claims made in the messages.
The appropriate historical conclusion is that KFC led the largest number of country-level negative-sentiment categories in this particular 2021 Twitter analysis. Any stronger claim would require a different body of evidence.
Why did Wendy's and Starbucks also rank prominently?
Wendy's appeared as the category leader in 11 countries, while Starbucks led in five, according to the September 2021 map summary. These results were unusual partly because the chains operate on different international footprints and sell different types of food and drink.
For example, The Takeout's September reporting listed South Africa's Wendy's score at 46.74% negative tweets and Russia's Starbucks score at 58.33%. Those percentages are not shares of the populations in the two countries; they refer to the analysed posts concerning the relevant brands.
There are also questions of context. A fast-food brand can be mentioned by people who live far from its restaurants, and some markets may have small numbers of comments compared with larger or more active Twitter communities. Social-media geography and business location do not necessarily align perfectly.
For that reason, “most hated by a country” is an imprecise popular description. “Highest proportion of negative brand tweets in the sample for that country” is closer to what the project measured.
Which fast-food chain led the US negative-tweet ranking?
In the United States, the RAVE Reviews analysis identified Domino's as the fast-food brand with the highest negative-tweet share among its selected companies, at 39.16%. The figure was reported by The Takeout and reiterated in Fast Company's October 2021 coverage .
That finding did not mean Domino's was the least popular food business in the United States, nor that 39.16% of Americans disliked its pizza. The denominator was a set of brand-related tweets classified by the researchers, not the US population or all customers who ordered food that year.
Fast Company noted that complaints about the chain included delays and food arriving cold. This kind of complaint may be important to customers, but a limited collection of social posts does not provide a complete satisfaction survey or independent validation of individual delivery experiences.
FlyingEze also published a separate 2021 article about Domino's trial of Nuro autonomous pizza delivery in Houston . That news concerns delivery technology rather than the RAVE ranking and is included solely as related historical industry reading.
What did the 2021 map show in Canada and other countries?
Canada produced one of the study's more surprising results: Orange Julius topped the fast-food negative-sentiment category, with 47.06% of tweets in the sample classified as negative. The figure appeared in Daily Hive's 5 October 2021 Canadian breakdown and in The Takeout's earlier analysis.
In Canada's broader food-brand comparison, Daily Hive also reported Wendy's at 41.65%, Tim Hortons at 37.98%, McDonald's at 36.82% and other familiar chains lower down the list. These are historical negative-tweet percentages, not independent measures of food safety or customer loyalty.
Other examples included Mexico's Taco Bell at 30% and Russia's Starbucks at 58.33%, both reported in The Takeout's September coverage. The figures illustrate that the map's results differed significantly by country. They do not establish whether the differences resulted from actual product experiences, the makeup of each social-media audience, temporary news events or the limited selection of brands.
The 2021 report was an entertaining illustration of online brand sentiment, not an objective cross-country comparison of restaurant quality.
Why Twitter reactions are not the same as national opinion
The strongest limitation of the ranking is sampling bias. A person who posts about a restaurant on Twitter is not necessarily typical of everyone who visits it. Some consumers complain publicly to obtain customer-service attention; others praise brands privately, use other platforms or do not post online at all.
Large chains may receive thousands of mentions from users with different experiences, while smaller brands can be underrepresented or omitted. A country can also have a very different level of Twitter usage from another country. This is especially relevant in markets where the platform was not widely used in 2021.
There are separate issues with automated classification. Sarcasm, slang, jokes, multiple languages and posts discussing a brand without reviewing it can be difficult to classify. A tweet containing negative words may criticise a news story involving a restaurant rather than the restaurant itself. Positive and negative sentiment may even appear in the same short post.
Campaign Asia's October 2021 assessment highlighted several of these shortcomings, including the study's limited brand selection and an unspecified data-collection period in the publicly available account. Fast Company likewise reported the likelihood that consumers were more motivated to post after negative experiences.
Without a representative sampling design, confidence intervals or a full breakdown of responses and classification checks for every country, it would be misleading to attach the authority of an international opinion poll to the ranking.
Does “most hated” mean a chain is losing customers?
Not necessarily. A restaurant can attract frequent complaints while still having substantial sales, popular menu items and loyal customers. Familiarity itself increases the number of opportunities for someone to post a critical message.
RAVE Reviews' ranking was based on proportions of classified tweets rather than market share, revenue, repeat purchases or the likelihood that customers would recommend the company. Those are different measurements, each answering a different question.
A consumer deciding where to eat might reasonably look at recent local restaurant inspections, current customer reviews, price, convenience and personal dietary preferences. A worldwide 2021 social-media map cannot determine the quality of a particular meal served in a particular city in 2026.
For the industry, however, social listening can identify patterns that merit investigation. Repeated complaints about incorrect orders, slow service or app failures can prompt a business to examine operations. The important next step is to check whether the online reports accurately reflect real problems and how broadly they occur.
Why the viral map became an entertainment story
The study's graphics offered a familiar format: a map, recognisable company names and a result likely to surprise readers. It was easy for commentators to compare their own favourites with the brands appearing in different countries, and to joke about whether an apparently unpopular chain was actually bad.
The lost FlyingEze title — “Open Post: Hosted by the Most Hated Fast Food Chains in the World” — belongs to that conversation-driven style of online entertainment. The phrase Open Post suggests an invitation to readers to discuss the subject, but an authentic copy of that specific post has not been recovered, so its precise jokes, authorship, date and reader comments cannot responsibly be reconstructed.
The verifiable underlying news value is the RAVE Reviews project and its reception in September and October 2021. That is why this recovery focuses on the source, results, methods and important qualifications instead of inventing material purportedly written in the lost original.
How should readers interpret the results today?
When old lists resurface online, the first questions should be when the research was conducted, who was included and what “worst” or “most hated” actually measured. Different methods will produce different answers. A restaurant review average, a customer-satisfaction interview, a hygiene inspection and a social-media sentiment score should not be treated as interchangeable.
A more recent 2024 analysis by Fast Company , for example, examined Google Maps ratings of individual fast-food locations using a different scoring system. Its results concerned particular outlets, not the national or worldwide sentiment percentages used by RAVE Reviews in 2021. Comparing the two would require accounting for those differences.
FlyingEze has separately covered expansion plans for American fast-food chains in the United Kingdom . That later business story offers context about the industry's international reach, not evidence for the old Twitter rankings.
The defensible takeaway is modest: the 2021 project captured a slice of online conversation about major brands, and that slice showed negative sentiment distributed differently across markets. It did not discover the universal worst fast-food chain.
Timeline of the 2021 “most hated” fast-food discussion
- September 2021: RAVE Reviews circulates a map-based analysis of negative tweets about major global brands, including a fast-food category.
- 24 September 2021: The Takeout reports the fast-food rankings, identifying KFC as leader in 14 countries and Domino's in the United States.
- 27 September 2021: Matador Network publishes the country-leader summary, including Wendy's, Starbucks and other chains.
- 5 October 2021: Fast Company examines the wider methodology and its limits; Daily Hive details Canadian scores.
- 2026 retrospective: The original RAVE Reviews study URL no longer displays the historic research, so the ranking must be reconstructed from contemporary reports and reproductions rather than treated as a current survey.
Frequently asked questions
Which chain was called the world's most hated in 2021?
In RAVE Reviews' 2021 Twitter-sentiment map, KFC had the highest negative-tweet percentage among selected fast-food brands in 14 countries, the most country-leading results in the category.
Which fast-food chain ranked worst in the United States?
Domino's led the selected US fast-food category with 39.16% of sampled tweets classified as negative.
Did RAVE Reviews survey consumers worldwide?
No. The study analysed brand-related posts on Twitter with automated sentiment software. It was not a representative international customer survey.
Does the result prove KFC or Domino's had the worst food?
No. The project did not measure food safety, taste, restaurant hygiene or the overall quality of meals in a controlled comparison.
How many tweets were analysed?
The researchers reported analysing more than one million brand-related tweets across the overall study, which covered several categories, not only fast food.
Can the 2021 ranking be used as a current list?
No. It is a historical dataset, and the selected brands, online platform, consumer behaviour and circumstances may have changed significantly since 2021.
Conclusion
The viral 2021 rankings made for lively conversation because they placed familiar names on a map and described them with the provocative label “most hated.” KFC led in 14 countries, Wendy's in 11 and Domino's was the US fast-food category leader in the selected Twitter sample. But the figures described negative language in tweets, not a verified measure of what all customers in those countries thought.
The useful lesson is about how data can become entertainment. Online sentiment can reveal complaints worth examining, but the platform, sample, algorithm and interpretation matter. A reliable historical reconstruction preserves both the reported 2021 findings and the limitations that made the headline more dramatic than the evidence itself.