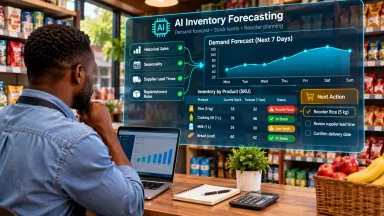

Before introducing AI inventory forecasting, a small retailer needs a trustworthy record of what was sold, when it was sold, which exact product was involved and whether that item was available to customers. Price changes, promotions, returns, store locations and supplier delivery times make the resulting forecasts more useful. Without these details, even an advanced model can mistake a stockout for weak demand or a promotion-driven spike for ordinary sales.
The good news is that a business does not need a huge data warehouse to begin. An organised POS export, an inventory movement record and a small amount of supplier information can support an initial forecasting trial. What matters is consistency, traceability and knowing where the gaps are.
This guide explains the essential fields, gives an example spreadsheet layout and shows how to audit sales data before paying for AI inventory software. Unlike a guide to choosing a forecasting model, it concentrates on the practical question: is your retail data ready to be trusted?
Why sales data quality matters more than an impressive AI dashboard
Forecasting software learns patterns from past observations. If one product is recorded under three names, returned items are counted as new sales and some days are missing entirely, the software may learn patterns that never existed. It can produce attractive charts while giving poor purchasing advice.
Microsoft's historical-demand import documentation illustrates the core requirements of a demand series: a product or allocation identifier, a site, a date and a demand quantity. Retailers may start with those four fields, then add more context to make results actionable. Academic research reviewing retail forecasting also identifies the complexity caused by store-level, product-level and promotional variation.
The goal is to know the difference between an actual customer buying nothing, a shop being closed, a file failing to import and a best-selling item running out before noon. Those four situations should never automatically become the same value in a forecasting spreadsheet.
The minimum sales dataset: seven essential records
1. Transaction date and time
Capture the date of each completed sale and ideally its local transaction time. This lets the business discover weekday patterns, pay-day demand or seasonal peaks. Use a consistent timezone, particularly if orders arrive from a website and several physical outlets. Store timestamps consistently and aggregate them using the branch's local calendar; late-night orders should not silently move into a different business day.
2. A stable SKU or product-variant ID
Give every sellable variant a unique identifier. A 500 ml drink, a 1 litre bottle and a six-pack are different units; so are a blue medium shirt and a black large shirt when stock is tracked separately. Keep a mapping when a product is renamed or an old POS code is retired. Product descriptions are useful for people, but they are unreliable identifiers for a model.
3. Quantity sold and unit of measure
Record physical units, not just naira value. Sales revenue alone cannot reveal whether a price increase or more items sold caused a higher turnover. Where products are sold by weight, carton or individual piece, standardise conversions; do not combine six cartons with six individual units as though they were equal.
4. Store, branch and sales channel
A shop in a busy market can sell at a different rate from a quieter neighbourhood outlet. Record a branch or location identifier. Where online and offline orders draw from different stock pools, preserve the channel too. If all channels share the same inventory, define how duplicate orders and reservation events are reconciled instead of adding them twice.
5. Transaction type and returns
Distinguish paid sales from voided receipts, cancellations, exchanges, refunds and returns. Use a documented rule for net sales, and preserve the raw event history. Returning a product today does not necessarily mean demand yesterday was negative. Also record whether the returned item is resellable, damaged or already written off.
6. Opening, closing and available stock
Pair sales with dated inventory observations. Include deliveries, reservations, branch transfers, shrinkage, write-offs and stock-count corrections. Most importantly, flag days or hours when an SKU could not be purchased. A closing balance of zero is a warning, but it does not by itself tell you when the shelf became empty.
7. Data-source and correction history
Track which POS, online store or inventory system supplied each record, when it was imported and whether staff later corrected it. These fields make discrepancies traceable. A corrected stock count should not overwrite every earlier version without an audit trail.
A practical field checklist for a forecasting spreadsheet
At the simplest level, use one row per SKU × location × day for daily forecasts. Keep the underlying receipts separately: daily aggregation is useful for forecasting, but the original transactions are needed to investigate unusual totals. Here is a suggested data dictionary, not a proprietary software requirement.
| Field | Priority | Example or purpose |
|---|---|---|
sale_date | Required | 2026-10-26 in the shop's local timezone |
sku | Required | RICE-5KG, an unchanging product ID |
location_id | Required for multiple locations | STORE-01 |
units_sold | Required | 12 units sold that day |
returns_units | Recommended | 0 returned units |
stock_available | Highly recommended | Usable on-hand units at a stated time |
stockout_flag | Highly recommended | True if unavailable during selling hours |
unit_price | Recommended | Actual price in the recorded currency |
promotion_flag | Recommended | Whether a discount or campaign applied |
closed_flag | Recommended | Shop did not open for normal trading |
receipt_id / source | Keep in raw records | Enables deduplication and audit |
Supplier lead times and purchase orders usually belong in related purchasing tables, not repeated on every receipt. Product attributes—category, brand, size, colour and lifecycle status—belong in a separate catalogue table joined by SKU. This keeps the data easier to maintain.
Sample CSV: What clean and problematic sales days look like
The following fictional example uses a single rice SKU in one store. It is for explanation only and is not a record from FlyingEze or a real retailer.
date,sku,store,units_sold,closing_stock,stockout,closed
2026-10-26,RICE-5KG,STORE-01,12,31,false,false
2026-10-27,RICE-5KG,STORE-01,14,17,false,false
2026-10-28,RICE-5KG,STORE-01,17,0,true,false
2026-10-29,RICE-5KG,STORE-01,0,0,true,false
2026-10-30,RICE-5KG,STORE-01,10,20,false,false
On 29 October, the record shows zero sales and no available stock. It would be unsafe to train a model as though customers wanted zero packs that day. The business may need to exclude that observation from an ordinary demand baseline or use a method that accounts for unobserved demand. On 30 October, the increase in stock indicates a replenishment occurred; the underlying stock-movement log should show the receipt and its timing.
This problem is called censored demand. In the academic paper Demand Estimation from Censored Observations with Inventory Record Inaccuracy , the author explains why historical sales may understate demand when inventory availability is limited or inaccurately recorded. The lesson for small retailers is straightforward: retain both sales and availability evidence.
How much historical sales data should you collect?
There is no universal minimum number of months that makes AI forecasting reliable. A shop with frequently sold household essentials may begin testing a simple weekly forecast using several weeks of consistent records. Christmas decorations, school uniforms and products with annual buying cycles need longer and more representative history to reveal seasonality.
The sensible requirement depends on the forecast horizon, selling frequency, product lifecycle and how much variation the business needs the model to learn. One full seasonal cycle can help identify annual effects; multiple comparable cycles are stronger evidence when they exist. More poor-quality records are not necessarily better than fewer well-explained ones.
For new products, data from genuinely comparable items and product attributes may help when there is no direct sales history. AWS's guidance for new-product demand forecasting recommends gathering related product histories, product attributes and optional promotional data. Mark those forecasts as more uncertain rather than pretending the new product has an established history.
Four supporting datasets that improve the forecast
Prices and promotions
Capture actual selling prices, discounts, bundle offers and campaign dates. A jump in sales during a two-for-one promotion should not automatically be repeated every ordinary week. For future prediction, include only promotional information that will be known when that forecast is made.
Supplier purchases and delivery times
Record order date, promised date, actual receipt date, quantities ordered and quantities delivered. This information is vital for replenishment recommendations: demand prediction says what customers might want, while inventory planning asks whether stock can arrive in time. A purchase-order backlog is not a sale.
Product catalogue and lifecycle
Keep categories, brand, pack size, units, variants, launch date and discontinuation date consistent. This prevents a new packaging size from being merged incorrectly with an older item and helps planners find reasonable analogues for new products.
Trading calendar and external context
Store opening days, known holidays, local events and weather may provide additional explanatory value for some categories. Do not add dozens of outside variables simply because a platform accepts them. Start with relevant, trustworthy signals and test whether they improve forecasting performance.
Clean the data before connecting an AI model
A retailer should implement the following checks before its first training run:
- Identify duplicates. A unique transaction-line key should not reappear because the POS export was imported twice.
- Review missing dates. Distinguish a legitimate zero-sale day from a closed shop, missing import or stockout.
- Reconcile totals. Compare POS unit sales with daily cash-up, online order fulfilment and stock movements; investigate large differences.
- Standardise products. Map obsolete codes, units of measure, bundles and variants to a controlled product catalogue.
- Mark exceptional events. Flag discounts, outages, branch closures, supplier disruptions and unusually large one-off orders.
- Keep an audit trail. Save raw exports, import dates, correction reasons and ownership of each data source.
- Validate timestamps. Apply one consistent reporting timezone and prevent future-dated transactions from contaminating historical reports.
Do not fill every blank value with zero. A missing stock balance is unknown, not evidence that the store had no stock. Likewise, avoid silently removing unusually high sales: a real festive-season surge may be exactly the pattern the business needs to learn.
A readiness scorecard for small retail businesses
This checklist can be completed in a spreadsheet before inviting software vendors to demonstrate forecasting. It is an editorial assessment framework, not an official industry certification.
| Question | Ready when… |
|---|---|
| Are SKUs and locations consistently identified? | Each relevant sale maps to a valid product and stock location |
| Are dates and quantities reliable? | Transactions reconcile and missing periods are explained |
| Can you identify stockouts? | Availability gaps are recorded, not confused with weak demand |
| Are cancellations and returns separated? | Gross sales, net sales and refunds have clear definitions |
| Are promotions and price changes captured? | Major demand spikes can be linked to known events |
| Are supplier lead times measured? | Actual delivery histories can inform replenishment |
| Can you recreate last month's figures? | Data can be exported, checked and explained by a responsible person |
If most answers are uncertain, fix record-keeping first. A simpler moving average is a better starting point than an AI model fed inconsistent sales. Microsoft's demand-forecasting process overview likewise places historical data gathering before baseline forecasting, human review and final approval.
Set up a basic data workflow without a major technology budget
For a single small shop, a weekly CSV export or spreadsheet may be enough for an initial test. A growing multi-branch business should favour a connected POS, inventory ledger and purchasing system so different staff members are not maintaining incompatible figures. Define who owns the product catalogue, who approves stock corrections and how the team handles sales recorded while the network is offline.
A retail platform such as P-Biz Solutions Retail Management describes connected products, stores, inventory, POS, purchasing and finance. Those operational records can help establish a forecasting data foundation; this is not a claim that its website currently offers a verified AI-demand-forecasting feature. Ask prospective providers about export formats, SKU-level history, stockout reporting and integration access.
Supplier and warehouse data also matter after the forecast is generated. FlyingEze's earlier article on third-party logistics and inventory management explains a related part of the stock movement process.
Test data readiness with a four-week pilot
Week 1: Choose 20–30 reasonably active SKUs and identify every source of sales and stock data. Pick items with varied demand patterns, not just bestsellers.
Week 2: Clean duplicates, confirm units and catalogue mappings, and reconcile daily sales against available stock. Mark stockouts, shop closures and promotions.
Week 3: Produce a simple baseline forecast from historical data available at each forecast date. Record predictions before comparing them with later outcomes. Keep supplier decisions under human review.
Week 4: Evaluate missing records, data correction time, forecast error and whether the process detects real availability issues. Only then consider an AI model, using the same historical cutoff and evaluation period as the baseline.
Check results at the level where stock will be ordered—often each SKU at each store—rather than only a grand total. Avoid training on data that would not have existed at the prediction date, such as a future promotion's actual sales or a completed supplier delay. That is data leakage, and it can make a model look more accurate in tests than it will be in practice.
Protect sensitive data before sharing it with an AI provider
Forecasting usually does not require customer names, telephone numbers, addresses or card details. Aggregate transactions by product, location and date wherever possible. Restrict access to raw receipts, safeguard credentials, agree retention terms and check whether a third-party service retains or trains on submitted information. Keep an exportable backup so a change of software does not erase the business's transaction history.
Frequently asked questions
Can I forecast inventory demand using only monthly revenue?
Monthly revenue can support broad business planning, but it is usually insufficient to decide which SKU to reorder. Inventory forecasts need units sold by identifiable product and a useful time interval, ideally with location and availability data.
Do I need customer personal information?
Normally no. Aggregate product-level sales, prices, promotions and stock history are more directly relevant to inventory forecasting than identifiable customer records.
What if my POS system has only three months of records?
Start with a modest baseline and a short forecasting horizon, documenting the uncertainty. Three months may reveal recent weekly patterns but will not establish reliable annual seasonality.
Should a day with zero sales be removed?
Not automatically. If the store was open and the item was available, zero demand may be valid. If the product was out of stock, the store was closed or the export is missing, mark that condition so the model does not learn a misleading zero.
Conclusion: Build a trustworthy sales history before buying AI
The first investment in AI inventory forecasting should be better retail records. Start with dated SKU-level unit sales, keep location and unit definitions consistent, preserve returns, and match each period with what was actually available to sell. Add prices, promotions, supplier deliveries and product attributes once the basics are dependable.
Before purchasing an AI tool, ask whether your team can explain last week's sales and stock changes for ten important products. If the answer is yes, you have the foundation for a meaningful forecast test. If not, improving data collection will probably create more immediate value than adopting a more sophisticated prediction model.