
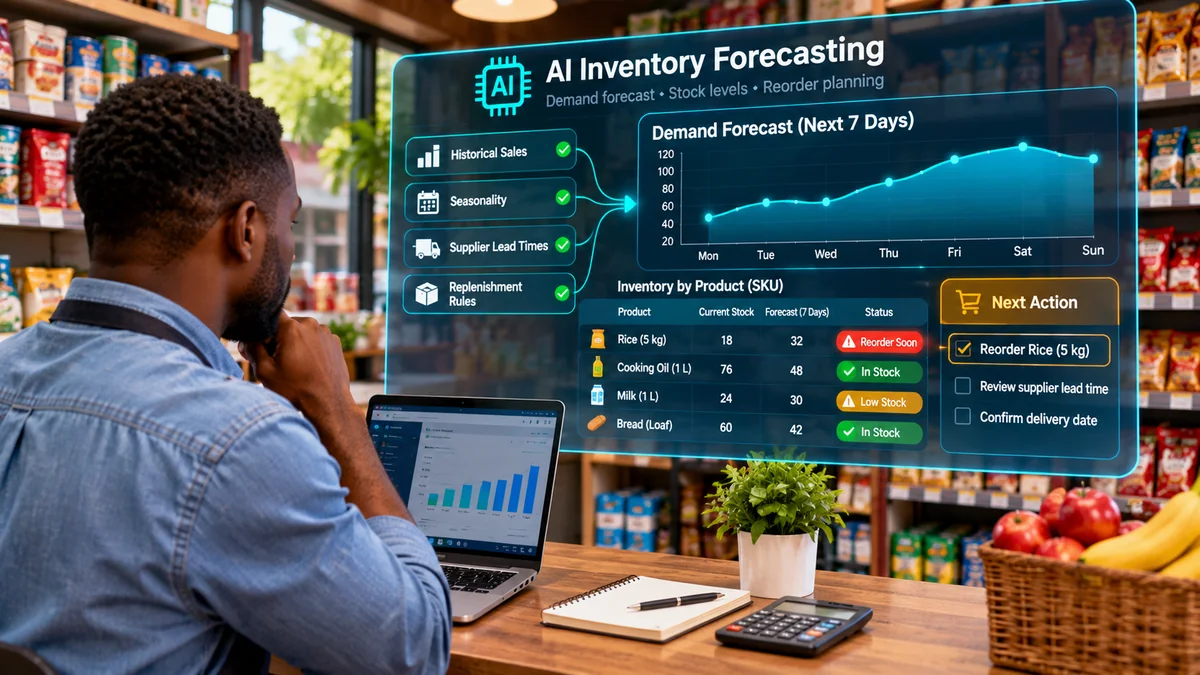
Small retailers can use AI inventory forecasting to estimate how much of each product customers are likely to buy, decide when to reorder and reduce avoidable stockouts. The most reliable starting point is not an expensive algorithm. It is accurate point-of-sale (POS) records, dependable stock counts, known supplier delivery times and a forecasting process that can be checked against real results.
For a neighbourhood supermarket, pharmacy, fashion shop or electronics retailer, running out of a popular item can mean a missed sale. Buying too much, meanwhile, traps cash in slow-moving merchandise. AI can help manage that trade-off by spotting patterns that are difficult to track manually, but it cannot eliminate uncertainty or repair inaccurate records on its own.
This guide explains what AI demand forecasting actually does, which data a small business needs, how to calculate reorder levels, how to choose software and how to run a modest pilot before trusting automated recommendations.
What is AI inventory forecasting?
Inventory forecasting estimates demand for products over a future period—such as the next week or month. Traditional approaches use simple rules, such as last month's sales or a moving average. AI and machine-learning approaches can learn from longer histories and additional signals, including product category, selling price, promotions, day of the week, seasonality and store location.
Demand is not the same as inventory. A forecast predicts potential customer purchases; stock planning uses that forecast alongside stock on hand, inbound orders, delivery times and a safety buffer to decide what to replenish. Retailers that mix these two steps can make the mistake of ordering every unit the forecast predicts, even when much of that stock is already available.
In its retail demand-forecasting guidance , Amazon Web Services describes combining current and historical data from POS, business systems and suppliers to inform demand estimates. Microsoft's demand-planning documentation shows that forecasting tools can use different statistical and machine-learning methods; there is no single algorithm that suits every product.
Why stockouts and overstocking are expensive for small shops
When a shopper wants a particular brand of cooking oil and the shelf is empty, they may buy a substitute, delay their purchase or visit another shop. The lost sale often goes unrecorded, and the retailer may mistakenly conclude that demand was low. When inventory piles up, the costs can include storage, product expiry, markdowns, insurance and money unavailable for another purchase.
These pressures are especially relevant where suppliers are inconsistent, imported merchandise has long lead times, or cash flow is tight. Better forecasting can help owners make more deliberate purchasing decisions. It is not a guarantee of higher profits: poor supplier performance and sudden changes in demand can still overwhelm an accurate prediction.
Start with the right data, not the most sophisticated AI
The foundation is a usable daily or weekly record for each stock-keeping unit (SKU) and, where applicable, each branch. Collect the following:
| Data | Why it matters |
|---|---|
| SKU, unit and selling location | Prevents mixing a 500 ml bottle with a 1 litre bottle, or sales from different branches |
| Units sold, returns and dates | Shows demand patterns over time |
| Opening, closing and available stock | Identifies missing inventory and periods when items could not be sold |
| Prices, discounts and promotions | Separates normal demand from marketing-driven spikes |
| Supplier order and delivery dates | Measures actual lead time rather than promised lead time |
| Stock transfers, damage and adjustments | Explains inventory movements unrelated to sales |
| Holidays, weather or local events, where useful | Helps explain predictable changes not visible in sales alone |
Start with whatever trustworthy history exists. Several months may be enough for a basic short-term pilot on fast-selling items; a full seasonal cycle is more useful for products with major annual peaks. Do not manufacture a year of data or assume that a few weeks reveal every seasonal pattern.
Most importantly, record when a product was out of stock. Sales are not necessarily equal to demand. An academic study of inventory estimation notes that a retailer cannot sell more than it has available, so historical sales can hide unmet demand. A model trained on these records without stockout flags can repeatedly underforecast popular products. See Demand Estimation from Censored Observations with Inventory Record Inaccuracy .
How AI turns sales records into a demand forecast
1. Clean and organise product-level records
Unify POS receipts, online orders and branch sales. Remove duplicate transactions, classify returns correctly and check that product identifiers do not change unnecessarily. Mark closures, promotions and missing-data periods instead of treating them as ordinary zero-sale days.
2. Establish a simple baseline
Calculate a recent four-week average, or compare demand on matching weekdays. For example, if a shop sells 80, 92, 88 and 100 units over four complete weeks, the basic weekly average is 90 units. This is an illustrative calculation, not a measured forecast for a real business.
3. Test a forecasting model against the baseline
A forecasting system may analyse trends, seasonal effects and known promotions to estimate future sales by SKU and branch. Begin with a short horizon that matches purchasing decisions—perhaps seven days for groceries or four weeks for slower-moving goods. Compare the AI predictions with the simple average on historical periods that the model did not use for training.
Google Cloud's retail forecasting discussion highlights an important principle: businesses need to anticipate demand at the location where stock will actually be needed, not just produce a company-wide total.
4. Translate the prediction into replenishment advice
A forecast should produce a recommendation for staff to review, not automatically trigger a purchase order without considering stock already on hand, open supplier orders, payment limits, shelf space and minimum order quantities. Keep human approval in place until the system has proven dependable.
Calculate reorder points and safety stock: a practical example
A reorder point is the inventory position at which a retailer should initiate replenishment so that a new delivery is likely to arrive before stock runs out. A common starting formula, explained in Shopify's reorder-point guide , is:
Reorder point = expected daily demand × supplier lead time + safety stock.
Consider a small shop selling packs of rice. The owner estimates demand at 12 packs per day, a supplier typically takes five days to deliver, and the shop chooses an 18-pack safety buffer to account for variation.
- Expected demand during lead time: 12 × 5 = 60 packs.
- Safety stock: 18 packs.
- Reorder point: 60 + 18 = 78 packs.
If the inventory position falls to 74 packs, the shop has crossed its reorder threshold and should review a new order. Inventory position typically considers usable on-hand stock plus stock already on order, less backorders or other committed demand. It is not always the number physically sitting on the shelf.
Importantly, 78 is a trigger, not the number of packs to purchase. The order quantity depends on the desired stock level, incoming deliveries, supplier minimum quantities, cash and shelf constraints. A longer or less reliable lead time may justify a different buffer, while perishable goods require extra care because excess safety stock can become waste.
When AI forecasts vary by date, managers can replace a flat daily average with predicted demand across the actual lead-time window. Safety stock should reflect a chosen service objective and uncertainty, not an arbitrary percentage that every SKU shares.
Which small retailers benefit most—and where AI can struggle
The right forecasting approach varies by merchandise:
| Retail type | Useful forecasting inputs | Main caution |
|---|---|---|
| Groceries and mini-markets | Daily POS sales, weekends, promotions, expiry dates | Avoid buying more perishables than can be sold |
| Fashion shops | Size, colour, season, promotions, local events | New collections may have little comparable history |
| Electronics and accessories | Model popularity, new releases, price changes | Demand can shift abruptly when products become obsolete |
| Pharmacies and health retailers | SKU sales, delivery reliability, expiry dates | Maintain appropriate legal, safety and professional controls |
| Hardware stores | Product family, project cycles, supplier lead times | Infrequently sold parts can defeat ordinary averaging |
New products pose a special challenge because there may be no sales history for that exact SKU. Use information from genuinely comparable items, document the uncertainty and start with cautious purchasing rather than presenting a model's output as certainty. AWS provides separate guidance on forecasting demand for new products , including the role of product lifecycle, promotions and price.
How to choose AI inventory tools on a small-business budget
There are three practical entry levels. A spreadsheet or basic POS report is suitable for establishing accurate stock counts and a moving-average forecast. A connected retail inventory system can consolidate products, sales, suppliers and branch records, reducing manual data reconciliation. Dedicated forecasting software or an AI-enabled add-on can then analyse more complicated patterns, if the business has sufficient clean data and a clear benefit.
Do not choose a product simply because its marketing mentions artificial intelligence. Ask whether it can:
- Import or synchronise sales and stock data from the retailer's existing POS.
- Forecast at SKU, variant and store level rather than only by overall revenue.
- Account for promotions, closures and days when stock was unavailable.
- Track actual supplier lead times and inbound purchase orders.
- Display forecast error and let staff override recommendations.
- Export data and document costs, security, availability and integration limitations.
For example, P-Biz Solutions describes a retail-management offering that connects products, stores, inventory, POS, purchasing and finance. Such connected records can form a foundation for forecasting, but retailers should confirm which forecasting or AI features, if any, are actually available before buying; an inventory module is not proof of an AI demand-prediction capability.
If deliveries are frequently late or routed through several warehouses, forecast quality must be considered alongside transport and fulfilment. FlyingEze's existing article on the impact of third-party logistics on inventory management provides related supply-chain context.
Run a four-week pilot before automating purchasing
Instead of modelling every product immediately, select 20–50 reasonably active SKUs across different sales patterns. This is a practical test size, not a universal requirement. Avoid relying solely on bestsellers, because it can hide problems with intermittent or seasonal items.
- Week 1 — Prepare: Reconcile stock counts, verify product IDs and lead times, and tag known promotions and stockout periods.
- Week 2 — Baseline: Create a simple forecast from historical sales, save its predictions and choose evaluation dates that were not used to build it.
- Week 3 — Compare: Run an AI or advanced statistical method on the same data and horizon, then compare its predictions with the baseline. Keep replenishment decisions under staff control.
- Week 4 — Review: Examine error patterns, stockout incidents, excess inventory and purchasing costs; extend the test only if it provides credible value.
Do not judge a method by an attractive chart alone. Track forecast error on known demand, percentage of available selling days, fill rate where reliable demand data exists, inventory turnover, expired or discounted units, and cash tied up in inventory. Withholding recent periods as a realistic test helps prevent overly optimistic results from training a model on information it would not have known at the time.
One simple measure is weighted absolute percentage error: sum the absolute unit forecast errors, divide by total observed units and multiply by 100. It is undefined when observed demand totals zero, and stockouts can distort recorded sales. Use suitable alternatives for sparse items and do not treat any one metric as a complete measure of financial performance.
Five mistakes that make AI stock forecasts unreliable
- Treating zero sales during a stockout as zero demand. Capture stock availability, customer requests and lost-sale indications wherever practical.
- Combining stores and product variants indiscriminately. A busy location should not conceal weak demand elsewhere, and different pack sizes may sell differently.
- Ignoring supplier delays. A correct sales prediction does little good if the order arrives after the shelf is empty.
- Automatically placing every suggested order. Apply budgets, expiry limits, approval rules and supplier constraints before purchasing.
- Never measuring forecast performance. Compare against a simple baseline and review the forecast regularly as customer preferences change.
Small teams should also limit access to sales and customer records, avoid uploading identifiable customer details to unsecured tools, and review data-processing terms before connecting external AI services.
Frequently asked questions
Can a small retailer use AI forecasting without a data scientist?
Yes, some tools offer managed forecasting or ready-made reports. The retailer still needs trustworthy data, a suitable process and staff who understand when to challenge unusual predictions.
How much historical sales data is needed?
There is no universal minimum. Simple forecasts may start with a shorter history, while annual seasonality requires longer comparable records. New items may need analogues from similar products and wider uncertainty margins.
Will AI completely prevent stockouts?
No. Unpredictable demand, supplier disruption, inaccurate stock counts and poor execution can still produce shortages. AI should support decisions rather than promise perfect availability.
Is an AI forecast the same as a reorder alert?
No. The forecast estimates likely demand. A reorder alert applies demand, lead time, current inventory position and safety-stock policy to decide when purchasing attention is needed.
Conclusion: Better inventory decisions start with better records
Small retailers do not need to become technology companies to benefit from demand forecasting. By recording accurate sales and stock movements, checking supplier lead times and testing simple forecasts against AI predictions, they can make more informed decisions about what to buy and when.
Begin with the products customers request most often, measure what changes and keep staff in control of purchasing. AI inventory forecasting becomes valuable when it reduces preventable stockouts without replacing one costly problem with another: shelves full of merchandise nobody wants.