
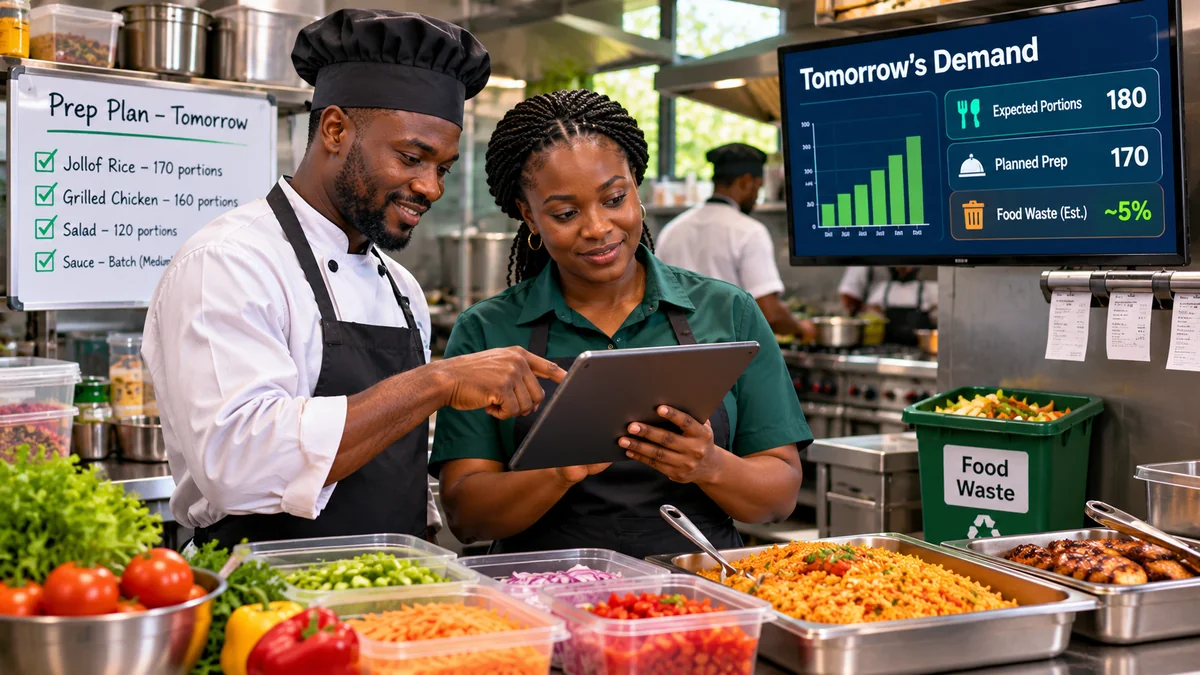
Restaurants can reduce avoidable food waste by predicting how many customers will order each dish, converting those forecasts into ingredient quantities, and preparing food in smaller, better-timed batches. Demand forecasting uses past orders, reservation patterns, the day of the week and other relevant information to estimate future sales. AI can help uncover complex patterns, but a reliable point-of-sale (POS) record and a simple forecasting baseline are often the best starting point for smaller restaurants.
The aim is not to cook the exact predicted number of meals and hope nothing changes. A workable plan balances uncertainty, food safety, guest service, storage limits and supplier reliability. This guide explains the practical steps, from measuring discarded food to translating forecast portions into purchasing decisions.
Why food-waste forecasting matters to restaurant finances
A restaurant can waste food at several stages: ingredients deteriorate before use, cooks trim or prepare more than needed, finished dishes remain unsold, and customers leave food on their plates. These types of waste have different causes and require different responses. Demand forecasting is most directly useful for preventing avoidable purchasing, preparation and unsold-food waste. Plate waste often calls for portion redesign, menu changes or better information about guest preferences.
The United Nations Environment Programme's Food Waste Index Report 2024 estimated that the global food-service sector generated 290 million tonnes of food waste in 2022. This is a sector-wide estimate, not a measure of the amount an individual restaurant could recover.
Published research provides reason to test forecasting rather than guess. A 2024 Journal of Cleaner Production study compared machine-learning models with conventional estimates using data from three catering services. The authors calculated that particular models could have reduced wasted meals by 14% to 52% in the studied settings. Those were study-specific modelled outcomes, not guaranteed savings or proof that deploying the software achieves the same results everywhere.
Better planning can also prevent missed sales. A restaurant that prepares too little of a popular dish may disappoint customers even while it throws away ingredients for less popular dishes. Forecasts are most useful when they help the kitchen make both decisions together.
Start by measuring where the food is actually wasted
Before choosing an AI platform, keep a simple waste log for at least two representative weeks; longer tracking is better where weekends, events or seasonal demand differ greatly. The US Environmental Protection Agency's food-waste prevention tools recommend recording the amount, type and reason for discarded food. WRAP also provides hospitality measurement guidance to help operators understand waste consistently.
| Waste category | Examples | First operational response |
|---|---|---|
| Spoilage and expired stock | Wilted vegetables, spoiled fish, products past safe use dates | Improve purchasing quantities, stock rotation and storage |
| Preparation loss | Excessive trimming, preparation mistakes, dropped ingredients | Standardise recipe yields and staff techniques |
| Overproduction | Cooked rice or soup left unsold after service | Forecast dish demand and adjust batch size |
| Plate waste | Unfinished servings returned by diners | Review portions, recipes and customer feedback |
Record the date, meal period, station, food item, quantity in kilograms or portions, reason, and estimated ingredient cost. Use consistent definitions so a kilogram of raw vegetable trimmings is not confused with one kilogram of finished meals. If the operation wants to track edible and inedible waste separately, record both rather than combining them without explanation.
What information does a restaurant demand forecast need?
A practical model works from menu-item sales by date, meal period and location. The most useful inputs often already exist in restaurant systems:
- POS transactions: dishes and quantities sold, order times, cancellations, refunds and dine-in versus delivery orders.
- Reservations and covers: expected guests, actual seated guests, no-shows, walk-ins and group bookings.
- Menu information: recipe ingredients, standard portions, prep yields, substitutions and temporary unavailable dishes.
- Promotions and special events: offers, holidays, large bookings, nearby events and unusual trading hours.
- Stock and purchasing: opening balances, deliveries, transfers, stockouts, expiry dates and supplier lead times.
- Relevant external signals: weather or seasonality where historical evidence shows they affect demand.
Be careful with the definition of demand. If the kitchen sold no grilled chicken because chicken was unavailable after lunch, recorded sales may understate customer interest. Mark those stockout periods rather than teaching a model that nobody wanted the dish. Likewise, a closed restaurant must not be represented as an ordinary day with zero demand.
A 2025 restaurant study used historical menu sales and weather data to predict daily item demand. That demonstrates a feasible modelling approach, but does not mean temperature and rainfall improve every restaurant's predictions. Test each extra data source against a simpler model before paying to collect it.
Forecast menu portions first, then convert them into ingredients
One of the biggest planning mistakes is predicting total restaurant covers and ordering ingredients directly from that number. Two days with 150 guests can consume very different quantities of rice, chicken or vegetables if the menu mix changes.
A better process begins with expected orders of each menu item, then applies a standardised recipe or bill of materials. It should account for the yield when trimming or cooking raw ingredients, the quantities needed for other dishes and actual usable stock on hand.
Worked example: Planning tomatoes for tomorrow's menu
Imagine a restaurant forecasts 90 portions of a dish tomorrow. Each portion uses 80 grams of usable tomatoes. After removing damaged or unusable material, the restaurant's measured preparation yield is 90%.
- Required usable tomatoes: 90 × 0.08 kg = 7.2 kg.
- Required whole tomatoes before preparation loss: 7.2 ÷ 0.90 = 8 kg.
- If there are 3 kg of safe, usable whole tomatoes available and no incoming delivery or other menu demand, the illustrative additional requirement is 5 kg, before any deliberately chosen buffer.
These figures are fictional and simplify real kitchen constraints. In practice, tomatoes might be used in several dishes, existing stock may have different remaining shelf lives, suppliers may sell only in crates and the kitchen may hold a small risk-adjusted buffer. The calculation is not an instruction to purchase exactly 5 kg in every situation.
For a real system, maintain recipe version history. A new serving size or supplier pack format should change planned ingredient consumption from its effective date, not silently rewrite previous periods.
Choose the right forecasting method for the size of the restaurant
Restaurants can begin with simple spreadsheet calculations before adopting machine learning. The best method is the one that improves decisions on real, unseen service periods, not necessarily the one that uses the most elaborate technology.
| Method | Best initial use | Limitations |
|---|---|---|
| Same-day-of-week average | Stable weekly lunch or dinner patterns | May miss holidays, events and changing trends |
| Recent moving average | High-volume items with steady demand | Can react poorly to abrupt changes |
| Booking-adjusted forecast | Reservation-led dining and group events | Must account for no-shows and walk-ins |
| Machine learning or AI | Several dishes and meaningful historical patterns | Needs clean data, monitoring and a baseline comparison |
In one academic study, researchers used Bayesian methods to forecast food and beverage sales in staff canteens and restaurants. Another study of restaurant demand examined how additional internal and external data changed the results of machine-learning and deep-learning models. The consistent lesson is not that every kitchen needs AI immediately, but that forecasting should be evaluated on the context of the operation.
For small menus, a spreadsheet plus POS exports may be enough. For larger multi-branch restaurants, connected inventory, purchasing and kitchen production records reduce manual reconciliation. The P-Biz Solutions Restaurant & Food Service Management public product description covers menus, POS, stock, purchasing and kitchen tickets. Those features can support the operational data needed for forecasting; they do not by themselves establish that a verified AI forecasting module is available.
Turn forecasts into a safer, more flexible kitchen prep plan
A forecast should inform when to prepare food as well as how much to buy. A practical restaurant can divide service into an initial batch and additional batches triggered by actual orders, using safe storage and cooking procedures. For example, instead of cooking every predicted portion at opening, the kitchen might prepare a measured initial quantity and keep appropriately stored ingredients ready for a second batch if demand materialises.
The precise batch sizes depend on service speed, recipe preparation time, storage capacity, staffing and food-safety requirements. Some dishes cannot be produced quickly in response to demand, and certain food-handling practices make late preparation impractical. Managers should test the workflow with chefs rather than treating an algorithm's suggestion as a kitchen instruction.
Food safety must never be sacrificed to avoid waste. The World Health Organization's Five Keys to Safer Food include keeping food clean, separating raw and cooked products, cooking thoroughly, maintaining safe temperatures and using safe raw materials. Follow applicable local food-safety rules and the business's validated procedures. A forecast cannot extend a use-by date, make improperly stored food safe or justify serving food that should be discarded.
How to forecast demand in a restaurant: an eight-step workflow
- Choose the decision window. Begin with the next day's lunch and dinner, or the coming week if purchasing lead times are longer. Match the forecast horizon to actual procurement and prep decisions.
- Export historical dish sales. Use item-level order counts for corresponding meal periods, not revenue totals alone. Preserve cancellation and stockout information.
- Add operational context. Include confirmed bookings, historical no-show rates, trading hours, holidays and promotions where they help explain demand.
- Establish a baseline. Start with recent comparable weekdays or a weighted moving average, documenting the period used.
- Test a more advanced model. Only add AI if it beats the baseline on dates that were not used for training, preferably across busy and quiet periods.
- Convert portions into ingredient needs. Apply standard recipes, trimming and cooking yields, inventory balances, existing purchase orders and delivery constraints.
- Prepare in controlled batches. Combine the forecast with staff judgement, safe handling rules and real-time orders. Keep manual overrides recorded.
- Measure the result. Compare actual orders, overproduction, stockouts, spoilage and plate waste, then update the forecasting and production rules.
Do not use today's actual meal orders as an input to a prediction supposedly made yesterday. That would be data leakage: it can make a model appear unusually accurate in testing without improving real decisions.
Measure results with the right food-waste KPIs
Forecast error alone is not the ultimate goal. A model could predict dish orders well but still fail to reduce waste if recipes are inaccurate, deliveries arrive late or chefs overproduce out of habit. Measure both demand accuracy and operational outcomes.
| Metric | How to interpret it |
|---|---|
| Forecast error by menu item | Difference between predicted and actual demand, interpreted carefully during stockouts |
| Kilograms of waste per 100 covers | A comparable waste measure that adjusts for guest volume |
| Overproduction in portions | Prepared meals remaining unsold and not safely repurposed |
| Spoilage cost | Recorded ingredient cost of inventory discarded as unsafe or unusable |
| Menu-item availability | Whether customers can order advertised dishes during service |
| Inventory turnover and purchase value | Whether less waste is achieved without tying up excess cash |
For example, if a restaurant records 18 kg of food waste across 300 covers in a week, the rate is 6 kg per 100 covers. That figure is illustrative; it should be split into preparation, spoilage and plate waste when possible, with the same measurement definitions used from week to week.
Compare at least several typical weeks and identify exceptions such as festivals, large events or temporary menu changes. When reporting percentage reductions, show the baseline, time period and whether figures cover all food waste or only a particular category.
A practical four-week pilot for small restaurants
Week one — establish the baseline: Choose a small group of high-volume or high-waste dishes. Collect POS counts, waste weights, portion recipes and purchasing histories. Speak to kitchen staff about why food is thrown away.
Week two — implement simple forecasts: Estimate portions by meal period using recent comparable days and bookings. Record predictions in advance, reconcile recipe ingredient yields, and keep all decisions subject to normal kitchen controls.
Week three — test revised prep: Adjust ingredient orders or staged preparation cautiously. Track customer availability, rush-hour delays and waste separately. Do not reduce buffers blindly for menu items with highly variable demand.
Week four — review before expanding: Compare waste quantities, cost and service outcomes with the baseline. If reliable data and sufficient scale justify it, trial an AI model against the same baseline. Expand only when the change improves real operations without compromising customer service or food safety.
The US EPA's food-service waste tracking tool recommends at least two weeks of daily tracking; a four-week pilot allows more operating context but should not be treated as proof of long-term results. Seasonal peaks and menu changes may require a longer assessment.
Common forecasting mistakes restaurants should avoid
- Forecasting total covers but not dishes: ingredient needs depend on what customers order, not only how many arrive.
- Ignoring reservations that do not arrive: use historical show rates and expected walk-ins, not confirmed bookings as guaranteed diners.
- Confusing sold portions with true demand: unavailable dishes can conceal customer interest.
- Using theoretical recipe quantities: test actual kitchen yields, serving sizes and ingredient substitutions.
- Combining different waste categories: plate waste may need portion changes, not another inventory forecast.
- Believing every AI saving claim: academic results are conditional, and individual restaurant outcomes must be measured.
- Compromising safe storage: no forecasting gain is worth foodborne illness or regulatory violations.
Frequently asked questions
Does a small restaurant need AI to reduce food waste?
No. Tracking discarded food, improving portion consistency, forecasting comparable weekdays and preparing in safe stages may deliver value before any AI investment. AI becomes more attractive when there is enough reliable data and complexity to justify it.
What is the difference between demand forecasting and inventory forecasting?
Demand forecasting estimates how many portions customers may order. Inventory planning converts that demand into ingredient requirements and then considers yields, available stock, delivery times and storage conditions. Both decisions are connected but not interchangeable.
Can weather and reservations improve forecasts?
They can, depending on the restaurant. Bookings may be particularly relevant for reservation-led dining, while weather may influence delivery orders or seasonal menus. Test whether each variable improves results compared with a simple historical baseline.
Can restaurants reuse leftover food to avoid throwing it away?
Only where its handling, temperatures, storage time, contamination risk and the applicable food-safety procedures make reuse safe and lawful. Forecasting should help prevent unsafe excess production, not encourage reuse of food that must be discarded.
Conclusion: Forecast portions, measure waste and protect food safety
Restaurants can make better purchasing and kitchen decisions by combining menu-item sales forecasts with reliable recipes, ingredient yields, stock records and waste measurements. A small operation can begin with a spreadsheet and staff judgement; larger kitchens may benefit from integrated systems and carefully tested AI forecasts.
The right measure of success is not a clever prediction on a dashboard. It is less avoidable waste, fewer sold-out dishes, better purchasing control and safe, consistent service. Start with one menu section, record the baseline and adjust based on evidence rather than assumptions.