
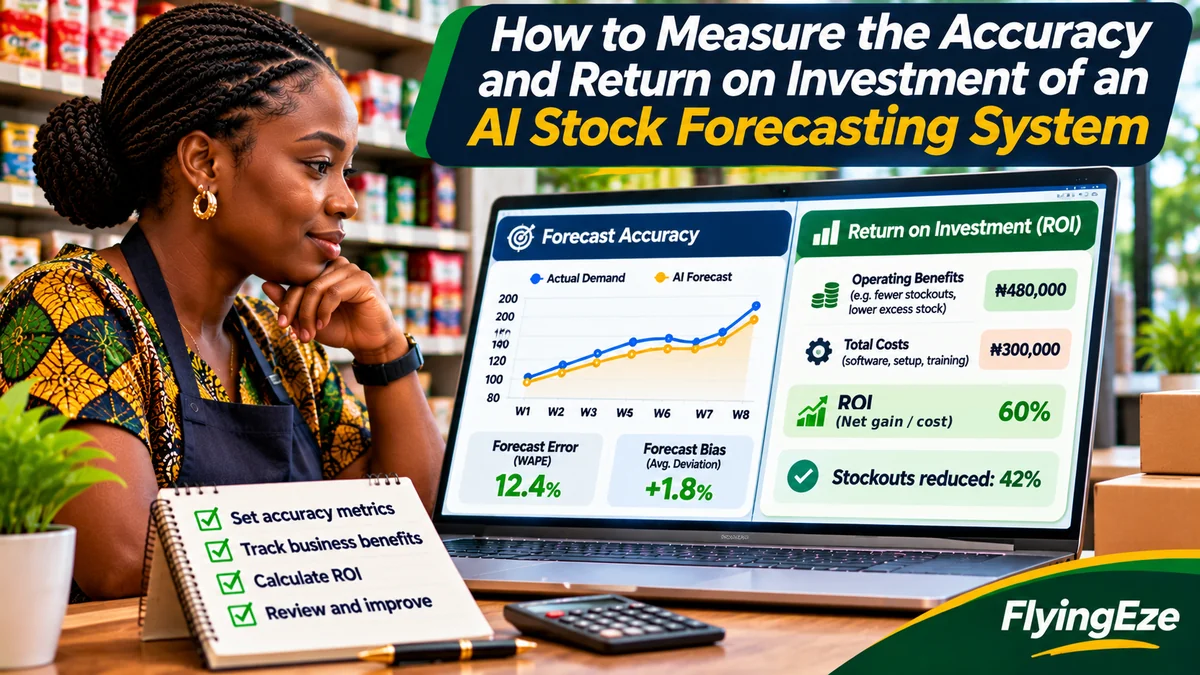
To measure the accuracy and return on investment of an AI stock forecasting system, compare its predictions with actual demand on unseen time periods, benchmark those predictions against your existing planning method, and calculate verified business benefits minus all incremental costs. A lower forecast error is useful, but it is not proof that inventory costs fell or profit increased.
A Nigerian retailer may experience fewer stockouts after installing forecasting software, yet the improvement could come from a more reliable supplier or extra safety stock. Another shop may reduce excess inventory without improving forecasting accuracy, simply by stopping unnecessary purchases. Measuring both prediction quality and operating results prevents an expensive technology decision from being made on a marketing claim.
Amazon Forecast's accuracy guidance explains how to evaluate predictions with backtests and metrics such as WAPE, MASE and RMSE. Microsoft Dynamics 365 distinguishes historical forecast accuracy from estimated model accuracy. These sources reinforce the central rule: measure what the system predicted before actual demand was known.
This guide includes practical formulas, hypothetical naira examples, a management dashboard and a 90-day evaluation plan. None of the illustrative figures represent actual performance from a vendor or Nigerian retailer. Research verified 3 November 2026.
Start with three questions, not one accuracy percentage
The first question is prediction quality: how close was expected demand to demand that customers actually generated? The second is operational impact: did purchasing and replenishment improve, with fewer missed orders and less waste? The third is financial return: did the additional contribution and savings exceed subscriptions, integrations, training and ongoing review?
A mathematically strong forecast can be useless if it arrives after the supplier's ordering deadline. A modestly better forecast can be highly valuable for an expensive, fast-selling item. Assign an owner to every measure and distinguish an algorithm's recommendation from the purchase order a manager actually approved.
1. Establish a fair baseline and freeze forecasts
Before evaluating AI, document the existing approach: last month's sales, a four-week moving average, spreadsheet formulas or a manager's demand estimate. Save each forecast with its creation date, horizon, SKU, branch and quantities. If old predictions were not archived, build a reproducible baseline using only information that would have been available on the original forecast date.
Test both methods on the same product set, locations and future period. Do not compare an AI forecast made after a promotion began with a spreadsheet estimate made weeks earlier. Avoid training the model on data that leaks future demand into the test window.
The forecasting reference Forecasting: Principles and Practice distinguishes training residuals from true test-set forecast errors and recommends time-series cross-validation. For inventory, the right test horizon should match the purchasing decision: if an order needs ten days to arrive, evaluate whether the forecast was useful ten days ahead.
2. Check data quality and recognise hidden stockout demand
Record accurate SKU identifiers, branches, units of measure, sales, returns, inventory counts, purchase receipts, supplier lead times, pending orders, promotions and known stockout periods. A carton of 24 units must not be mixed with a single unit; returned goods should not be treated as new demand.
Recorded sales can be lower than real demand. A store selling zero drinks while its shelf is empty does not prove that no one wanted drinks. Research in the International Journal of Forecasting explains that demand inferred solely from sales during stockouts can be biased downward, a problem known as censored demand.
Use documented unfulfilled orders, customer requests or properly justified estimates where available. Label estimates separately and disclose uncertainty. Never invent lost demand to improve a model's score. Sparse new products and items with intermittent sales may require longer histories or similar-product references.
3. Measure mean absolute error (MAE)
Mean absolute error reports the average magnitude of the forecast's mistakes in the units being predicted:
MAE = Sum of absolute differences between forecast and actual demand ÷ Number of observations.
If weekly errors for a product have absolute values of 2, 5, 12 and 8 units, its MAE is 6.75 units. Lower is better on an otherwise identical test set. MAE is easy for buyers to understand but cannot be compared directly between a product selling ten units weekly and one selling several thousand.
4. Calculate WAPE and understand its limitations
Weighted absolute percentage error measures aggregate error relative to actual demand:
WAPE (%) = Sum of absolute forecast errors ÷ Sum of actual demand × 100.
For example, 50 units of absolute error against 440 actual units gives WAPE of 11.36%. A lower result reflects less error for that evaluation sample. AWS uses WAPE in forecasting evaluation and also describes MASE , which scales error against a simple baseline.
WAPE can conceal weak forecasts for low-volume or high-margin products because large-volume items dominate the denominator. If total actual demand is zero, WAPE is undefined. Do not interpret a “95% accuracy” claim without asking for the underlying formula, test horizon and product coverage.
5. Track signed bias as well as absolute error
Absolute errors do not reveal whether a system consistently orders too much or too little. Define signed bias consistently:
Forecast bias (%) = (Total forecast − Total actual demand) ÷ Total actual demand × 100.
With this convention, positive bias means overforecasting and negative bias means underforecasting. Chronic underforecasting can drive lost sales; overforecasting can increase storage, expiry or markdown losses.
The financial cost of the two errors differs by product. AWS explains that quantile-based forecasting losses can penalise shortages and excess stock differently. A fast-moving essential may justify a higher protective demand quantile than a short-life bakery item, but neither should follow a universal target without considering real costs.
Worked example: AI versus spreadsheet forecast accuracy
Suppose a fictional shop evaluates four weekly predictions for a product using the same historical data cutoff and verified demand:
| Week | Actual units | Spreadsheet | AI |
|---|---|---|---|
| 1 | 100 | 90 | 98 |
| 2 | 120 | 110 | 125 |
| 3 | 80 | 100 | 92 |
| 4 | 140 | 130 | 132 |
| Total | 440 | 430 | 447 |
The spreadsheet's absolute errors total 50 units (10 + 10 + 20 + 10), while the AI system's total 27 (2 + 5 + 12 + 8).
| Metric | Spreadsheet | AI system |
|---|---|---|
| MAE | 12.50 units | 6.75 units |
| WAPE | 11.36% | 6.14% |
| Signed bias | −2.27% | +1.59% |
The hypothetical AI forecast has less error: WAPE is about 5.23 percentage points lower. But four weeks are far too few to establish robust superiority, and the test does not show whether the suggested orders were executed or whether suppliers delivered. Extend the backtest across multiple windows and representative products before spending money.
6. Run rolling backtests at the actual order horizon
Use rolling-origin evaluation. Pick a historical date, generate predictions using only information known then, observe the subsequent period, move the cutoff forward and repeat. Preserve model versions, promotion information and forecasts as originally issued; do not overwrite yesterday's prediction with today's improved estimate.
Report scores for each branch, product group, demand frequency and lead-time horizon, not just a company-wide average. AWS Supply Chain's forecast model analyser provides examples of aggregate and granular measures, including WAPE and bias, across backtests.
If seasonal items lack sufficient past cycles, disclose that limitation. Also check for leakage: a forecast for next week's orders must not use a stock count, promotion result or sales figure only known after next week began.
7. Track operational outcomes customers actually experience
Forecast accuracy is a means, not the goal. Measure whether actual availability, ordering and working capital improved:
| KPI | Practical definition |
|---|---|
| Unit fill rate | Units fulfilled immediately ÷ verified units demanded |
| Stockout incidence | Recorded unfilled orders, unfulfilled purchase attempts or stockout periods |
| Inventory turnover | Cost of goods sold ÷ average inventory valued at cost |
| Average stock investment | Average inventory cost across comparable dates |
| Waste and markdowns | Documented expired, damaged or discounted stock losses |
| Supplier delivery reliability | Orders delivered in full and on time versus agreed terms |
| Planning effort | Measured labour time and verified paid expenses avoided |
Shopify's product availability guidance explains fill-rate, stockout and turnover measures. Track these against comparable baseline periods, adjusting where possible for promotions, changes in prices and supplier delivery. A model cannot repair an operational failure simply by predicting demand correctly.
For businesses using outside warehouses or carriers, FlyingEze's article on third-party logistics and inventory management provides useful context for the gap between predicted demand and actual fulfilment.
8. Calculate true financial return on investment
Use a consistent period, preferably with incremental costs measured against the existing planning approach:
Net benefit = Verified incremental financial benefits − Incremental system costs.
ROI (%) = Net benefit ÷ Incremental system costs × 100.
Potential benefits include additional gross contribution from genuinely recovered sales, avoided spoilage, demonstrably lower holding expenses and reduced paid overtime. Recovered sales must be valued after relevant variable costs, not simply at revenue. Do not claim “saved hours” as cash savings unless labour spending or other productive output measurably changed.
Include software subscription, integrations, setup, data cleaning, training and ongoing monitoring, plus reasonable allocation of initial costs over the evaluation period. The Shopify inventory-cost guide distinguishes shortage, holding, ordering and financing expenses, helping owners avoid double-counting.
Worked example: calculating ROI in naira
Consider a fictional multi-branch retailer reporting these monthly equivalent amounts after a controlled pilot:
| Verified incremental benefit | Amount |
|---|---|
| Recovered gross contribution from previously lost sales | ₦220,000 |
| Avoided expiry and damage write-offs | ₦90,000 |
| Lower documented storage or financing expenses | ₦70,000 |
| Reduced paid overtime or external planning costs | ₦100,000 |
| Total benefits | ₦480,000 |
| Incremental monthly equivalent cost | Amount |
|---|---|
| Software subscription | ₦135,000 |
| Allocated integration and setup costs | ₦75,000 |
| Allocated data preparation and training | ₦50,000 |
| Extra oversight and support labour | ₦40,000 |
| Total costs | ₦300,000 |
Net benefit = ₦480,000 − ₦300,000 = ₦180,000. ROI = ₦180,000 ÷ ₦300,000 × 100 = 60%. This is a fictional calculation, not a reported vendor return. Verify that each benefit is incremental, attributable and not already counted elsewhere.
Suppose the same retailer also reduces average inventory investment by ₦1.2 million. That is working capital released, not ₦1.2 million of profit. Report it separately from ROI. Actual financing charges avoided because less cash is tied up in stock may qualify as a benefit, but must not be added twice if they are already included in the ₦70,000 saving.
For major investments, assess the timing of setup payments, contract commitments and cash flows as well as this monthly-equivalent percentage. A simple ROI measure is not a complete discounted-cash-flow valuation.
9. Avoid claiming AI caused every improvement
A change in supplier, a festive shopping period, a new promotion or a shift in branch traffic can alter sales and stock levels independently of forecasting. Where practical, test AI-assisted replenishment against comparable products or branches still using the previous approach. Record unusual events, pricing, policy changes and human purchasing overrides.
If managers keep ignoring the forecast recommendations, distinguish algorithm performance from implementation performance. If the business changed purchasing rules simultaneously with software adoption, explain that limitation rather than attributing all improvements to AI.
10. Build an auditable forecast and ROI dashboard
Record forecast creation timestamp, SKU, branch, horizon, predicted units, actual demand, out-of-stock flag, model version, planned and completed purchase orders, supplier arrival dates and the relevant costs. Keep historical forecasts immutable so managers can test what was known at the time.
Group the dashboard into four views: forecast accuracy (MAE, WAPE, bias), availability (fill rate and shortages), inventory investment (turnover, average stock and waste), and economics (attributable benefits, incremental expenses, cash released and ROI).
Existing retail operations software may already collect some of this information. P-Biz Solutions lists inventory and business-management products; check the specific modules and integrations available to your business before assuming an AI measurement dashboard is an existing feature.
A realistic 90-day evaluation plan
- Days 1–15: reconcile stock records, product units, returns and lead times; identify unavailable products and missing demand data.
- Days 16–30: define the spreadsheet baseline, freeze predictions at creation dates and agree the accuracy and financial metrics in advance.
- Days 31–60: run AI forecasts with human-approved ordering, record model outputs and purchasing overrides, and preserve a comparable control workflow.
- Days 61–75: evaluate forecast error, fill rate, inventory and supplier outcomes by product and branch.
- Days 76–90: independently validate incremental contribution and cost changes; calculate ROI and decide whether to continue, adjust or stop the pilot.
Ninety days is an initial operational review period, not proof that a seasonal forecast is reliable. Products with intermittent or highly seasonal demand may require many more historical cycles or a longer controlled evaluation.
Warning signs of misleading vendor performance reports
Question any “99% accurate” claim without a disclosed metric, forecast horizon, withheld test period and product list. Be wary when difficult items are excluded, the model sees future sales during training, stockout days are treated as zero demand, or only aggregate accuracy is presented.
Financial warning signs include counting the full retail price of recovered sales as profit, treating all inventory reductions as earnings, assigning cash value to unpaid labour hours, excluding setup costs or claiming every operational improvement came from the model. Insist on reproducible results and clear definitions before authorising automatic purchasing.
Frequently asked questions
What is a good WAPE for AI stock forecasting?
There is no universal threshold. Assess the improvement relative to a fair baseline, the product's demand pattern and the financial cost of errors. An acceptable result for frequent low-margin sales may not be appropriate for an expensive slow-moving item.
Is forecast accuracy the same as stock availability?
No. Forecast accuracy measures prediction error; availability measures fulfilment of customer demand. Poor purchasing execution and supplier delays can cause stockouts despite accurate forecasts.
Does a lower inventory balance count as ROI?
Not automatically. Lower inventory releases working capital. Count separately verified carrying-cost or financing savings as benefits, without treating the entire value of stock released as profit.
Which metrics should a small business start with?
Use MAE, WAPE where suitable, signed bias, fill rate, average inventory at cost and attributable monthly net benefit. Add more advanced metrics only where they improve decisions.
Can AI forecasting have positive ROI without perfect accuracy?
Yes. Reliable improvements in the costliest shortages, waste or planning expenses can provide value even when forecasting error remains. The improvements must be demonstrated and not assumed.
Should the model place orders automatically during a pilot?
Usually not. Start with human approval, documented spending limits and complete records. Consider automated purchase execution only after forecast performance, inventory data and supplier constraints have been validated.
Conclusion
An AI stock forecasting system pays for itself only when its predictions lead to measurable improvements worth more than its full incremental cost. Test it against existing planning on truly unseen periods, report MAE, WAPE and bias, correct for stockout-distorted demand, and track stock availability alongside cash and inventory expenses. A disciplined pilot with transparent calculations is more useful than a polished accuracy chart with no verified financial result.