
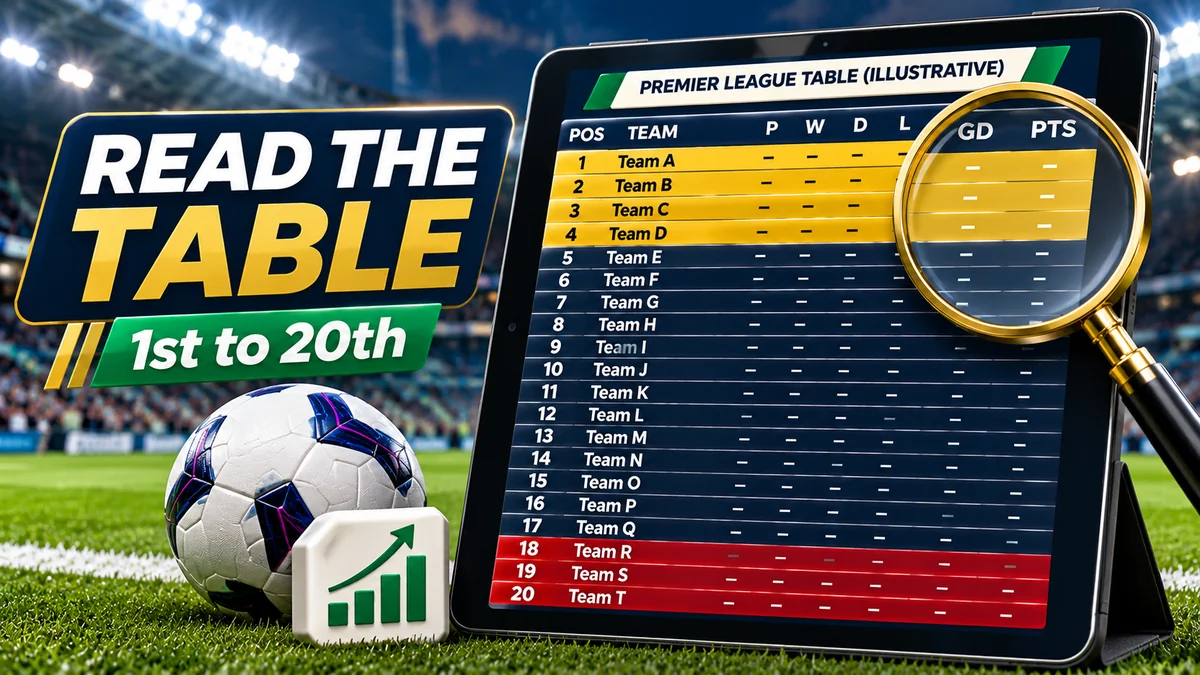
To read a Premier League table from first to 20th, start with the position and points columns, then check matches played, goal difference and recent form. First place is the league leader; 20th is last. Teams earn three points for a win, one for a draw and none for a loss. Clubs finishing 18th, 19th and 20th after the final round are relegated—but a team in those places in November is not yet relegated.
If you are searching for the Premier League table 1 to 20, there is an important distinction: the official 2026/27 Premier League standings show the clubs' changing positions, while this guide teaches you how to interpret any matchweek, without pretending that a static table remains live.
Below is a beginner-friendly, step-by-step walkthrough of each table column, the significance of all 20 positions, and what to check when two teams look evenly matched.
Step 1: Find the official table and check the season
Open the Premier League's official table . Check that you are viewing First Team rather than U21 or U18, and confirm that the season is 2026/27 rather than a historical campaign. Other sports websites may show a compact or custom version, but the essential statistics are the same.
Look at the update context. An in-progress match, a postponed fixture, or two games taking place at different times can produce a temporary table. A final-whistle standings update is more reliable than assuming every graphic is final. Screenshots copied to social media might be hours or months old.
The Premier League's competition explainer confirms that 20 clubs each face the other 19 twice, once at home and once away. That means 38 games per team and 380 matches across the completed season. During the season, teams may have played different numbers of games.
Step 2: Read one team's row from left to right
Most standings pages use the following headings. A full table might also show a club badge, arrows, recent form, or the next opponent.
| Label | Plain-English meaning | Example |
|---|---|---|
| Pos | The team's current place in the league, from 1 to 20 | 6 |
| Team | Club name | Example FC |
| Pl or P | League matches played | 12 |
| W | Wins | 6 |
| D | Draws | 3 |
| L | Losses | 3 |
| GF or F | Goals for: scored by the team | 21 |
| GA or A | Goals against: conceded by the team | 15 |
| GD | Goal difference: GF minus GA | +6 |
| Pts | League points, normally 3 × wins plus draws | 21 |
| Form | Recent W/D/L sequence, often the last five games | W–D–L–W–W |
This is an illustrative row, not an actual Premier League club's record. Its numbers are consistent: 6 wins + 3 draws + 3 losses = 12 games; (6 × 3) + 3 = 21 points; and 21 goals for − 15 goals against = +6 goal difference.
Get into the habit of checking the Pts column first and Pl second. Those two numbers tell you how far ahead a club is and whether it has played more matches than its closest rivals.
Step 3: Understand what positions 1 through 20 mean
The numbered rows run from the strongest points record at the top to the lowest-ranked team at the bottom, subject to the official ranking rules. Not every position has a permanent prize attached. The table below is a position-reading guide, not current team standings.
| Place | How to interpret it |
|---|---|
| 1st | Current leader; becomes champion only if it finishes first |
| 2nd | Nearest title challenger by table position |
| 3rd | High league position, normally within the top-four Champions League group |
| 4th | Normally the final standard Champions League league-position spot |
| 5th | European contention; may gain a Champions League place if England receives an additional allocation |
| 6th | Possible European place depending on UEFA allocation and cup results |
| 7th | May qualify for Europe in certain cup and allocation scenarios |
| 8th | Upper-middle table; no automatic reward from the number alone |
| 9th | Upper-middle table; compare points gaps to nearby teams |
| 10th | Near the middle of a 20-club table |
| 11th | Near the middle, just into the bottom half |
| 12th | Mid-table position; check distance to Europe and the bottom three |
| 13th | Lower-middle position; no relegation solely from this rank |
| 14th | Lower-middle position; remaining fixtures influence risk |
| 15th | Compare points buffer over 18th, rather than assuming danger |
| 16th | Close to the survival cut-off by position, not necessarily by points |
| 17th | Last position above the relegation places |
| 18th | First relegation position if the season ended there |
| 19th | Relegation position if it remains at the season's end |
| 20th | Bottom-ranked team; relegated if still there at the end |
Why isn't sixth place always the Europa League? European places depend on UEFA rules, association performance allocations and the winners of domestic cup competitions. The Premier League's European qualification guide sets out how those opportunities can move. A label like “European spot” shown in a standings app is therefore conditional until the relevant criteria are settled.
Step 4: Calculate points without guessing
The Premier League uses three points for a win, one for a draw and zero for a defeat. You can calculate the ordinary match-points total as:
Points = (wins × 3) + draws.
Imagine a club with five wins, four draws and three defeats from 12 matches. It has 15 points from wins plus four from draws, totalling 19 points. The defeats add nothing to the total.
For a second quick check, played = wins + draws + losses. If the table shows P 12, W 5, D 4 and L 3, those figures balance.
In an exceptional case, the league may impose or record an official points adjustment. A team's displayed total can then differ from the simple match-results formula. Always use the official table for the legally recorded standing rather than overriding it with a manual calculation.
Step 5: Calculate goal difference and compare clubs with equal points
Goal difference (GD) = goals scored (GF) − goals conceded (GA). If a team scores 24 and concedes 17, its GD is +7. If it scores 11 and concedes 26, the GD is −15. A higher goal difference is better when teams have the same points.
Here is a fictional mini-table showing how small differences affect ranking:
| Rank | Team | Pl | W | D | L | GF | GA | GD | Pts |
|---|---|---|---|---|---|---|---|---|---|
| 1 | Harbour FC | 10 | 5 | 3 | 2 | 20 | 14 | +6 | 18 |
| 2 | Bridge FC | 10 | 5 | 3 | 2 | 18 | 12 | +6 | 18 |
| 3 | Valley FC | 9 | 5 | 2 | 2 | 18 | 13 | +5 | 17 |
Harbour and Bridge have identical points and GD. Harbour goes above Bridge because it has scored more goals (20 rather than 18). Valley has played one fewer match, but its potential three points from that unplayed game are not added in advance. It is third in this example because it currently has only 17 points.
That produces the key reading order: points → goal difference → goals scored. The Premier League's official tie-breaker explanation confirms the sequence and the additional steps available for consequential final ties.
Step 6: Notice games in hand without inventing extra points
A game in hand means a team has played one fewer fixture than a team it is being compared against. It may arise when matches are rearranged for cup competitions, scheduling, weather or other reasons.
In the example above, Valley has played nine games to the others' ten. It can potentially gain three points by winning its next match. But if it draws, it earns one; if it loses, it earns none. This is why commentators say a team could move above a rival, not that it already has.
Points-per-game calculations are useful for informal analysis of different match counts. They are not a substitute for the ordinary official points table. Do not rank teams by multiplying hypothetical results from unplayed fixtures.
A quick comparison habit is to ask: How many points apart are they? How many games has each played? Who has the stronger GD?
Step 7: Read arrows, colours, form and next fixtures correctly
Some websites colour the top rows gold or blue, the bottom three red, and show small arrows beside team names. These colours and arrows are visual aids rather than extra competition rules.
A green arrow may mean a team has moved up since the previous update; a red arrow may mean it has fallen. An unchanged mark typically means no movement. Always check the website's own legend, because display conventions differ.
Form usually shows a short series of recent match results, such as W–D–L–W–W. That sequence is useful for spotting momentum, but the formal standing is determined by accumulated points and the official tie-breakers. A club with three consecutive wins may still rank below a rival that earned more points earlier in the season.
Next or Next fixture identifies an upcoming opponent. This can help you understand a team's schedule, but a predicted result should not be treated as an awarded point.
How do the Premier League's final tie-breakers work?
Goal difference and total goals scored settle many ties, but there is a further procedure for teams whose final positions matter to the championship, qualification for another competition or relegation.
The official order after points is goal difference, goals scored, points earned in head-to-head league matches, and away goals scored in those head-to-head matches. A neutral-venue play-off is a last resort when a consequential final placing still cannot be decided. The Premier League's relegation FAQ sets out the relevant sequence.
For someone simply checking a matchweek table, remember the first three measures. Do not put head-to-head results ahead of goal difference as you might in another football competition. For a full explanation of end-of-season tie-breaking scenarios, the linked official Premier League rule guidance gives the authoritative basis.
How to read the title race, European race and relegation battle
The title race: look at gaps, remaining games and GD
The side in first is the leader, but the title remains undecided until its advantage cannot be overturned under the rules. Check how many points separate first and second, their games remaining, and the goal-difference comparison. A club can trail with a game in hand and still have a credible chance to lead, but only actual results change the standings.
The European race: read the qualifying markers as conditional
Finishing high in the table can earn European football, but allocation rules are not identical every season. England normally receives four Champions League places through league position, with potential extra places depending on UEFA's European Performance Spots; domestic cup results can affect Europa League and Conference League qualification. Confirm the season-specific allocation before concluding that sixth or seventh guarantees a particular competition.
For how one of those competitions itself works, see FlyingEze's UEFA Champions League format and qualification guide .
The relegation battle: compare 17th with 18th first
The boundary between 17th and 18th is often the most useful part of the table for understanding the survival fight. The three clubs finishing 18th, 19th and 20th after the completed season go down to the Championship, as explained by the Premier League .
But a side in 18th may be only one point behind 17th, while another 18th-placed side could be much further adrift. Comparing rank alone misses the gap. Look at points, games remaining and GD to understand how much the team would need to change its position.
There is no universally guaranteed “safe” points total. The popular idea that 40 points always avoids relegation is a rule of thumb, not a competition rule.
Read a real standings headline without making a mistake
Imagine the headline “Club climbs to fourth after a 2–1 victory.” The result tells you the club earned three points and improved its GD by one. It does not mean the side has secured a Champions League place, because the season may still have many games left.
FlyingEze's published report on Brighton moving to the top in August 2026 is an example of a historical standings update. Its position claim describes a particular moment; it is not a substitute for the official current table .
Likewise, a headline about which of two clubs is above the other should be checked against points, GD and GF rather than the teams' reputation. FlyingEze previously examined that issue in “Why Are Newcastle Above Chelsea in the Premier League Table?” , a historical example of why close standings attract scrutiny.
A 30-second checklist before sharing a Premier League table
- Season: Does it say 2026/27, another year, or a historical final table?
- Status: Is the snapshot live during matches, updated after full time, or from yesterday?
- Points: Who has earned more points, excluding any imagined results?
- Matches played: Does either club have a game in hand?
- Ties: If points match, compare GD and then GF.
- Consequence: Is the position provisional, or does it reflect the final season's title, European qualification or relegation outcome?
If a screenshot is missing the date, season and source, do not present it as the latest table. A direct link to the official table is more reliable than a reposted image.
Frequently asked questions
How many positions are in a Premier League table?
There are 20 positions. Each club plays 38 matches in a completed season, giving 380 league fixtures in total.
What does Pts mean?
Pts is the points total. A win normally earns three, a draw one and a loss zero. Official penalties or adjustments can affect the displayed total.
Why can a team with fewer wins be higher?
It may have collected more draws and therefore more total points. The league ranks points, not wins alone.
Can a club be above another after playing fewer matches?
Yes. Current points determine placement, with the official tie-breakers where required. Unplayed games do not count as victories in advance.
What are the Premier League relegation positions?
18th, 19th and 20th at the end of the season. Seventeenth is the last position above the relegation zone.
Where can I see the latest Premier League table 1 to 20?
Use the official Premier League 2026/27 table . Confirm the season and last update, particularly when matches are in progress.
Conclusion: read the points first, then the story behind them
Reading a Premier League table from first to 20th does not require advanced statistics. Start with the league position, check points, compare matches played, and use goal difference and goals scored to understand close rankings. Then look at recent form and upcoming fixtures for context without confusing them with awarded points.
At the top, the standings show who is leading the title race; in the middle, they show the gaps between clubs; at the bottom, they identify the battle to avoid finishing 18th through 20th. Keep the date and competition rules in view, and a complex-looking table becomes a clear picture of the season.