
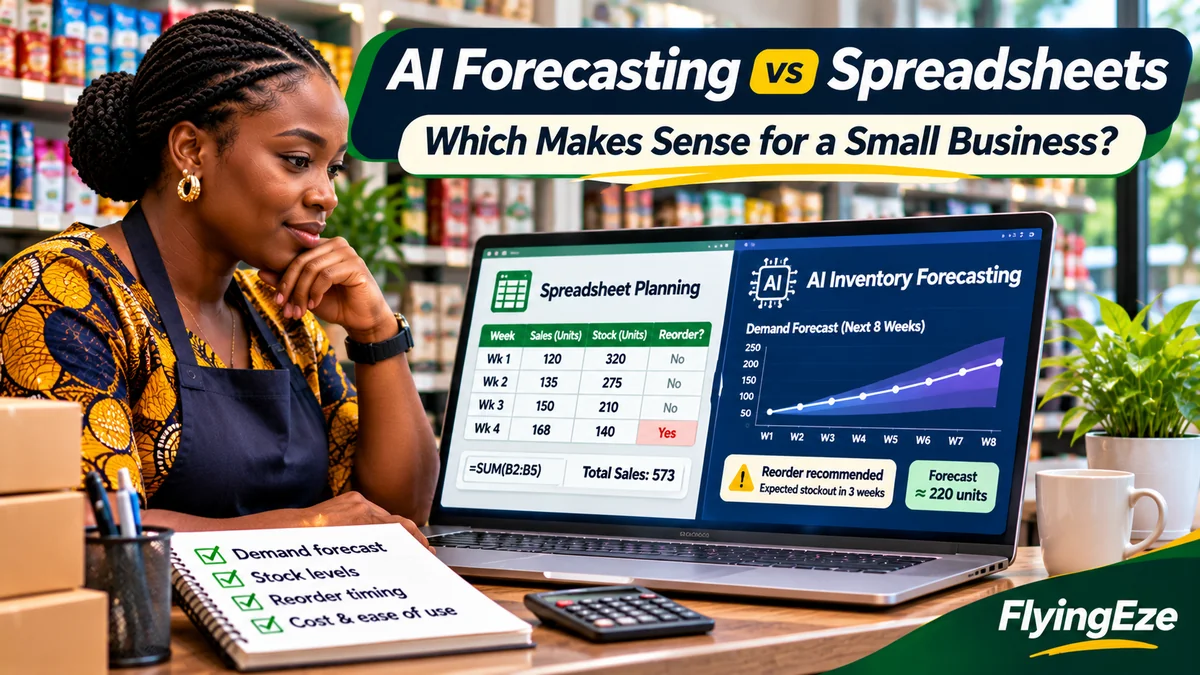
For most small businesses with a limited product range and reliable sales records, spreadsheet inventory planning is the sensible starting point. AI inventory forecasting becomes worth testing when the business has enough clean historical data, many products or branches, frequent demand changes, and stock decisions costly enough to justify software and implementation expenses. Neither approach guarantees accurate predictions; the right choice is the one that improves actual stock availability, reduces excess purchases and saves more money than it costs.
A Nigerian provisions shop that sells 30 familiar products may need only a weekly sales worksheet, a reorder threshold and disciplined stock counts. A supermarket with hundreds of product variants across several branches may struggle to update separate formulas for promotions, holidays and changing buying patterns. IBM's explanation of AI demand forecasting describes how predictive models can incorporate historical demand and additional signals; Microsoft's forecasting guidance shows that ordinary Excel also supports statistical forecasts.
This guide compares the costs, benefits, limitations and practical implementation steps for both approaches. Naira calculations are fictional illustrations, not vendor quotations, measured Nigerian averages or evidence that AI consistently outperforms spreadsheets. Research verified 3 November 2026.
What exactly is inventory forecasting?
Inventory forecasting estimates how many units customers are likely to want during a future period so a business can purchase and replenish at the right time. It is different from inventory tracking, which records what is on shelves or in warehouses. A POS can know you have 90 units today without accurately predicting next month's demand. Forecasting links expected demand to supplier lead times, stock on order, outstanding reservations and an acceptable safety buffer.
Good forecasts protect two competing goals: minimise stockouts that cause lost sales and minimise overstock that ties up cash, shelf space and possibly perishable products. The Oracle Retail demand planning guidance describes forecasting as an input to purchasing, replenishment and stock allocation, not an independent guarantee of profit.
Neither a spreadsheet nor an AI system knows a surprise supplier shutdown, a sudden exchange-rate-driven price increase or a future promotion with certainty. Managers must still review the purchasing decision.
How spreadsheet inventory planning works
A basic spreadsheet records product code, opening stock, units sold, receipts, returns, reserved stock, current balance, supplier lead time and reorder level. Simple formulas generate alerts when the stock position approaches a threshold. An owner can update demand assumptions from observations such as payday shopping, festive-season sales or changes in wholesale prices.
Spreadsheets are not limited to taking averages. Microsoft's FORECAST.ETS documentation describes a statistical exponential-smoothing forecast based on evenly spaced historical observations, including handling of seasonality and certain missing periods. Microsoft's Excel Forecast Sheet also produces a chart and uncertainty ranges. Availability varies by Excel edition and platform; for example, Microsoft says FORECAST.ETS is unavailable in Excel for the web.
These features are useful for a business comfortable with spreadsheets, but staff must still maintain accurate data, protect formulas, and keep separate versions from becoming inconsistent.
What AI inventory forecasting adds
AI-assisted forecasting generally uses statistical learning or machine-learning models to estimate demand by product, location or period. Depending on the product and configuration, it may incorporate historical sales, promotions, prices, holidays, seasonality, stockout history and supplier information. Microsoft Dynamics 365's algorithm documentation illustrates the range: ETS, Auto-ARIMA, Prophet and XGBoost are different forecasting approaches, not one universal “AI formula.”
Systems may reforecast many product-location combinations automatically and highlight unusual demand or replenishment needs. This can make a difference when a retailer manages hundreds of SKUs across branches and sales channels. However, more sophisticated modelling is not automatically more accurate. Poor transactions, unrecorded stockouts, inconsistent SKUs or sparse sales can mislead any algorithm.
AI forecasting is also not the same as asking a general-purpose chatbot, “What should I buy next week?” A production inventory forecast should be built on controlled transaction data, validated calculations and an auditable replenishment workflow.
AI versus spreadsheets: which is better for your situation?
| Decision factor | Spreadsheet planning | AI-assisted forecasting |
|---|---|---|
| Small catalogue, one shop | Often sufficient and easy to inspect | May add unnecessary expense |
| Multiple branches and hundreds of variants | Manual consolidation can be difficult | Can automate location/SKU forecasts if integrated |
| Short or incomplete sales history | Simple judgment-led baseline is transparent | May be unreliable without suitable additional data |
| Seasonality, promotions and price changes | Requires manual adjustments or complex formulas | Can model multiple variables when well configured |
| Setup and operating cost | Usually lower incremental software cost; staff time still matters | Subscriptions, integration, training and monitoring costs |
| Control and explainability | Formula and assumptions are directly visible | Depends on vendor explanations, model governance and override controls |
| Ongoing maintenance | Staff update source data and formulas | Staff maintain data quality, integrations and model performance |
The practical middle ground is common: keep a spreadsheet or familiar inventory system as the trusted planning baseline, then pilot automated forecasts for high-volume categories or the most unpredictable locations. A hybrid workflow also gives staff a clear comparison point before they delegate purchasing decisions.
What data must be trustworthy before either method works?
Start with clean product identifiers and a consistent unit of measure. A carton of 24 drinks is not interchangeable with one bottle; sales and inventory balances must use compatible units. Record dated sales quantities, returns, cancelled sales, stock adjustments, supplier receipts, current stock, outstanding purchase orders, reserved orders and actual delivery times.
Also record stockout periods. If a retailer sold zero units because the shelves were empty, that is not proof customers wanted zero units. Oracle's forecasting preprocessing documentation explains that out-of-stock observations and short-lived promotions can distort normal sales patterns. Reconstructing unconstrained demand may require additional evidence such as lost-order records or comparable products; it should not be fabricated.
For a new product, past sales of similar products, product attributes and known promotional events may help, but uncertainty remains high. AWS's guidance on forecasting new-product demand describes using similar-product sales and relevant metadata rather than pretending the new SKU has its own historical record.
Worked spreadsheet example: a sensible reorder decision
Consider a fictional Nigerian retailer selling packaged drinks. Its sales over the last eight weeks were 42, 48, 40, 50, 54, 50, 58 and 58 units. The total is 400 units, so the simple baseline forecast is 50 units per week, or approximately 7.14 units per day. Assume a supplier typically delivers ten days after an order and management provisionally holds 30 units as safety stock.
Reorder point = Expected demand during supplier lead time + Safety stock.
Using these assumptions, the reorder point is 50 ÷ 7 × 10 + 30 = 101.43 units, rounded up to 102 units. Shopify's reorder-point guide uses the same general relationship between sales velocity, lead time and safety stock.
| Measure | Illustrative value |
|---|---|
| Average weekly demand | 50 units |
| Average daily demand | 7.14 units |
| Supplier lead time | 10 days |
| Chosen safety stock | 30 units |
| Reorder point | 102 units |
| On-hand stock | 90 units |
| Allocated or reserved | 12 units |
| Already on order | 20 units |
| Inventory position | 98 units |
Inventory position here is 90 − 12 + 20 = 98 units. Because 98 is below 102, a reorder review is triggered. The business must still check when the 20 incoming units will arrive, supplier case sizes, remaining usable stock and available cash. This example's 30-unit safety stock is a management assumption, not an automatically correct buffer or a guaranteed service level.
With a product list, these calculations can be implemented through spreadsheet columns and conditional alerts. A carefully maintained simple model often beats an elaborate forecast built on unreliable records.
Where AI might outperform a spreadsheet
Suppose the same retailer expands to several branches selling hundreds of variants. Demand differs by location and changes with school terms, public holidays, promotional discounts or local events. A manually updated average can lag behind those changes, while a model supplied with reliable signals may identify patterns at the product-by-branch level.
Oracle's retail planning documentation describes models for seasonal, trending, irregular and promotion-influenced demand. Such systems can also create exceptions for items requiring a buyer's attention instead of forcing staff to review every row.
But AI can also fail with sudden disruptions, new products, missing inventory counts or training records that mistake stockouts for weak demand. A forecasting vendor should therefore provide a clear way to inspect inputs, export predictions, explain exceptions, apply human overrides and measure real outcomes.
Test accuracy before believing an AI accuracy claim
Do not compare an AI forecast made after seeing actual sales with a spreadsheet forecast prepared beforehand. Use a fair backtest: train both approaches on the same historical data, predict a later period that was hidden from both methods, and compare predictions with recorded demand. Repeat the test across relevant products and seasons if sufficient data exists.
For illustration only, suppose four weekly actual demands are 54, 46, 60 and 50 units (210 total). A spreadsheet baseline predicts 50 units each week, while a hypothetical model predicts 53, 48, 55 and 56.
| Week | Actual | Spreadsheet | AI example |
|---|---|---|---|
| 1 | 54 | 50 | 53 |
| 2 | 46 | 50 | 48 |
| 3 | 60 | 50 | 55 |
| 4 | 50 | 50 | 56 |
| Total absolute error | — | 18 | 14 |
The spreadsheet's mean absolute error is 4.5 units per week; the hypothetical model's is 3.5 units. Dividing total absolute error by total actual demand gives approximately 8.6% versus 6.7% for this example. These figures illustrate a calculation, not measured AI performance; four weeks is far too little evidence for a purchasing decision.
Also test whether the approach reduced stockouts, unnecessary stock, spoilage and purchasing effort. Forecast accuracy is not the same as profit. For intermittent products that record many zero-demand periods, percentage error measures can be misleading or undefined. Forecasting researcher Rob Hyndman discusses more suitable scaled measures for such demand.
Calculate the true cost before paying for a forecasting system
Compare total incremental costs with benefits the business can document. Costs can include subscription, POS or ERP integration, data cleaning, staff training, management review and implementation work. Buying software does not automatically remove the need for people to check inventory records.
Consider this fictional monthly business case: a system costs ₦50,000 in subscription fees, ₦20,000 in staff time and ₦10,000 in amortised setup costs, for ₦80,000 total. It demonstrably prevents 35 previously lost sales that each contribute ₦2,500 in gross profit after the relevant variable costs, and reduces separately verified holding or expiry losses by ₦12,500. Benefits total ₦100,000, leaving an estimated ₦20,000 monthly net benefit.
That case supports continuing a pilot only if the recovered sales and savings can actually be attributed to better decisions, do not overlap or double-count, and continue over a reasonable evaluation period. If the same system produces only ₦45,000 of verified benefit, it is uneconomic on those assumptions even if its forecast chart looks impressive.
Be especially careful when a vendor quotes “percentage improvement in accuracy.” Ask how it was measured, which products were included, how stockouts were treated and whether the comparison uses identical historical periods. Avoid making a purchase decision from unsupported savings percentages.
Which approach makes sense for different Nigerian businesses?
Single-branch provisions shop: Begin with a simple weekly worksheet, reliable stock counts, a list of fast sellers and supplier reorder points. Upgrade only when the reporting effort or repeated costly mistakes justify it.
Fashion boutique: A spreadsheet may suffice for a small range, but short fashion cycles, sizes, colour variants and heavy discounting create more complex demand. Human judgment remains particularly important for a collection with little history.
Restaurant or bakery: Ingredient forecasting should reflect sales, recipes, perishability, prep schedules and supplier lead times. Automation becomes attractive when multiple menus, branches and shifts make manual reconciliation difficult.
Multi-branch retailer or wholesaler: Integrated forecasts and inventory-position alerts can help coordinate purchasing and transfers, but only if stock movements, branch balances and supplier receipts are accurate. A separate article from FlyingEze on how third-party logistics affects inventory management explains why delivery arrangements also matter to stock availability.
In Nigeria, actual planning should also account for supplier reliability, transport disruptions, power-related storage risks, import price changes and festive-season demand where relevant. These are possible business drivers, not claims that every Nigerian retailer experiences the same pattern.
Can existing business software help without promising “AI”?
Before buying a separate prediction platform, check whether the current POS, stock ledger or operations system already provides sales reports, reorder alerts, supplier history and branch-specific stock data. Reliable records and automated reconciliation may deliver more immediate value than a sophisticated model.
P-Biz Solutions publicly lists inventory, operations and related business-management capabilities, including for hospitality and retail use cases. Assess the modules and integrations available in your specific plan before assuming a production-ready AI forecasting engine is included. The relevant question is whether a chosen tool provides clean data, actionable replenishment recommendations and understandable controls—not whether its marketing calls everything “AI.”
A 30-day plan to choose between spreadsheet and AI forecasting
- Week 1 — Audit data. Clean SKU codes, stock units, returns, supplier lead times and out-of-stock records. Reconcile on-hand quantities.
- Week 2 — Build the baseline. Forecast sales using a documented spreadsheet method and calculate reorder points for high-value products.
- Week 3 — Run a controlled pilot. Test an AI forecasting service on the same historical data and product groups; record its prediction dates and assumptions.
- Week 4 — Compare outcomes. Evaluate forecast errors, stock availability, excess stock, staff time, cash requirements and total cost. Decide whether to retain spreadsheets, use a hybrid method or expand the pilot.
Thirty days is an operational starting plan, not a sufficient period to validate annual seasonality. Longer trials may be necessary for intermittent sales, festive demand or products with long lead times. Keep purchase approvals under human control during the trial, restrict access to supplier and customer records, and avoid sharing identifiable customer data with AI vendors unless there is a legitimate business need and adequate data-protection safeguards.
Frequently asked questions
Can Excel forecast inventory without AI software?
Yes. Simple averages, reorder formulas and Excel's statistical forecasting functions can support demand planning. Microsoft provides FORECAST.ETS and Forecast Sheet tools in supported desktop versions, though features differ by edition and platform.
Is AI inventory forecasting always more accurate than spreadsheets?
No. Accuracy depends on data quality, patterns, the selected model and how the comparison is performed. Test both approaches on genuinely unseen demand periods and evaluate operational outcomes.
How much sales history do small businesses need?
There is no universal minimum. A simple average can use a short history but may miss seasonality; richer forecasting of annual patterns typically benefits from multiple seasonal cycles. New products may need comparable-item information and judgment.
Does AI remove the need for safety stock?
No. Even a strong demand forecast is uncertain, and suppliers may deliver late. Safety stock remains a way to manage variability, with the amount based on demand, lead time, service goals and affordability.
What if many products sell only occasionally?
Irregular or intermittent demand can make simple percentage errors unreliable and some models unstable. Consider suitable intermittent-demand methods, longer evaluation periods and careful grouping rather than treating zero sales as proof of zero interest.
Should the business automate purchase orders immediately?
Usually not at the beginning. First validate SKU balances, data, supplier lead times, forecast quality and financial controls. Start with recommended orders that a responsible employee reviews before enabling any automatic purchasing.
Conclusion: the right forecasting tool is the one that earns its place
Spreadsheets are often the best first tool for a small business; AI forecasting is worth testing when complexity and the cost of mistakes exceed the cost of automation. Start with accurate stock records, a transparent reorder process and a baseline forecast. If a more advanced system reliably reduces stockouts, excess inventory and staff effort in a fair trial, expand it gradually. Let measured results—not the presence of an AI label—determine the investment.